Fig. 6.

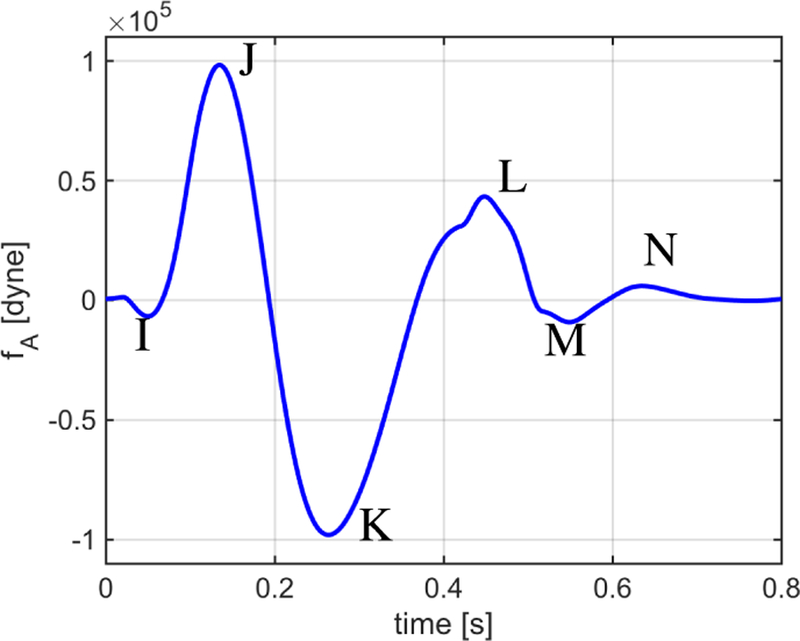
Waveform fA simulated via the closed-loop model over one cardiac cycle. The waveform exhibits the typical I, J, K, L, M and N peaks and valleys that characterize BCG signals measured experimentally.

Waveform fA simulated via the closed-loop model over one cardiac cycle. The waveform exhibits the typical I, J, K, L, M and N peaks and valleys that characterize BCG signals measured experimentally.