
Figure 8.
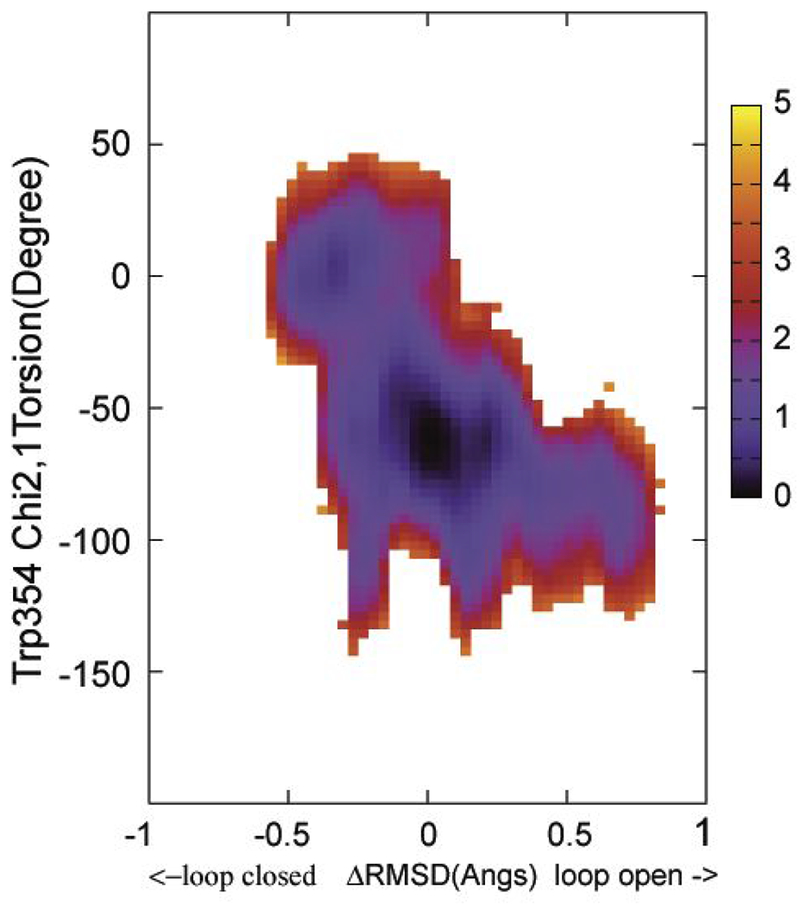
The free energy landscape as determined by 2D WHAM analysis of the umbrella sampling data on NEB determined structural evolution images along the loop open-closure conformational exchange pathway. ΔRMSD is the X coordinate and Chi2,1 is the Y coordinate. The two end starting structures were prepared from PDBID:1PA9 and PDBID:1YPT according to the procedure described in Methods section. The side bar shows the color coded energy levels (kcal/mol).