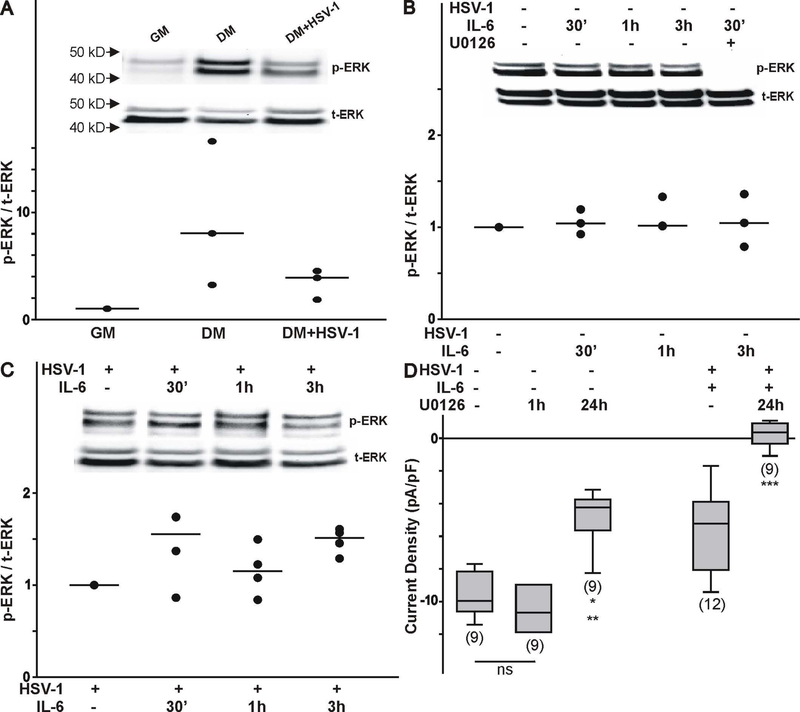
Figure 6.
Effect of ERK1/2 activation on the functional expression of T-type Ca2+ channels in differentiated ND7/23 cells. A) Effect of cell differentiation and HSV-1 infection on ERK activation as assessed by changes in phosphorylated ERK (p-ERK). Note that differentiated cells (following 4 d culture in differentiation media-DM) expressed higher levels of p-ERK compared with ND7/23 cells cultured in growth media (GM). Infection of differentiated ND7/23 cells with HSV-1 evoked a significant reduction in p-ERK. Overall changes in p-ERK was normalized to total ERK (t-ERK) expression under each culture condition (number of independent cell cultures n=3). B) Time course of ERK activation following stimulation of differentiated ND7/23 cells with IL-6 (20 ng/mL). Immunoblot analysis was used to determine changes in ERK activation by assessing the levels of phosphorylated and total ERK. ERK activation in differentiated ND7/23 cells can be inhibited by pre-treatment with the ERK blocker U0126 (10 μM). In these experiments, cultures were pre-treated with U0126 for 1 h prior to stimulation with IL-6 (number of independent cell cultures n=4). C) In HSV-1 infected cells, IL-6 evokes an increased in ERK activation (number of independent cell cultures n=4). D) The ERK inhibitor U0126 blocked the stimulatory effect of IL-6 on T-type Ca2+ channel expression. Note that 1 h treatment with U0126 did not alter the functional expression of T-type Ca2+ channels, suggesting a lack of an allosteric effect on channels already present in the membrane. Overnight incubation with U0126 prevents the normal expression of T-type Ca2+ channels on the membrane. In HSV-1 infected cells treated with IL-6, inhibition of ERK activity with U0126 caused a completed disruption of channel expression. The number of cells recorded under each condition is presented in parenthesis from 2 independent cell cultures. * denotes p ≤ 0.05 vs. control (non-infected cultures); ** denotes p ≤ 0.05 vs. HSV-1 infected cell cultures treated with IL-6.

