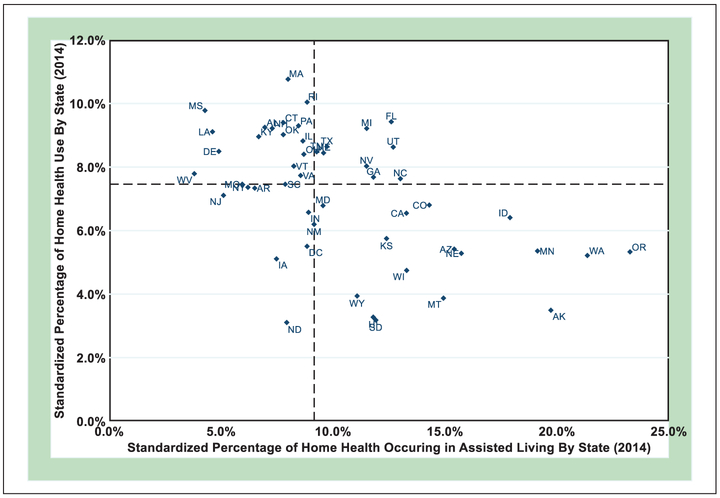
Figure 1.
State-level standardized percentage of home health agency services delivered in assisted living and standardized percentage of home health use among all Medicare beneficiaries in the state (2014).
Source. Outcome and Assessment Information Set C and Medicare Master Beneficiary Summary File, 2014.
Note. State rates standardized by age, sex, and race. Dashed lines indicate median values.

