
Figure 5. Ninety-day mortality, infection and organ failure development in alcoholic hepatitis patients.
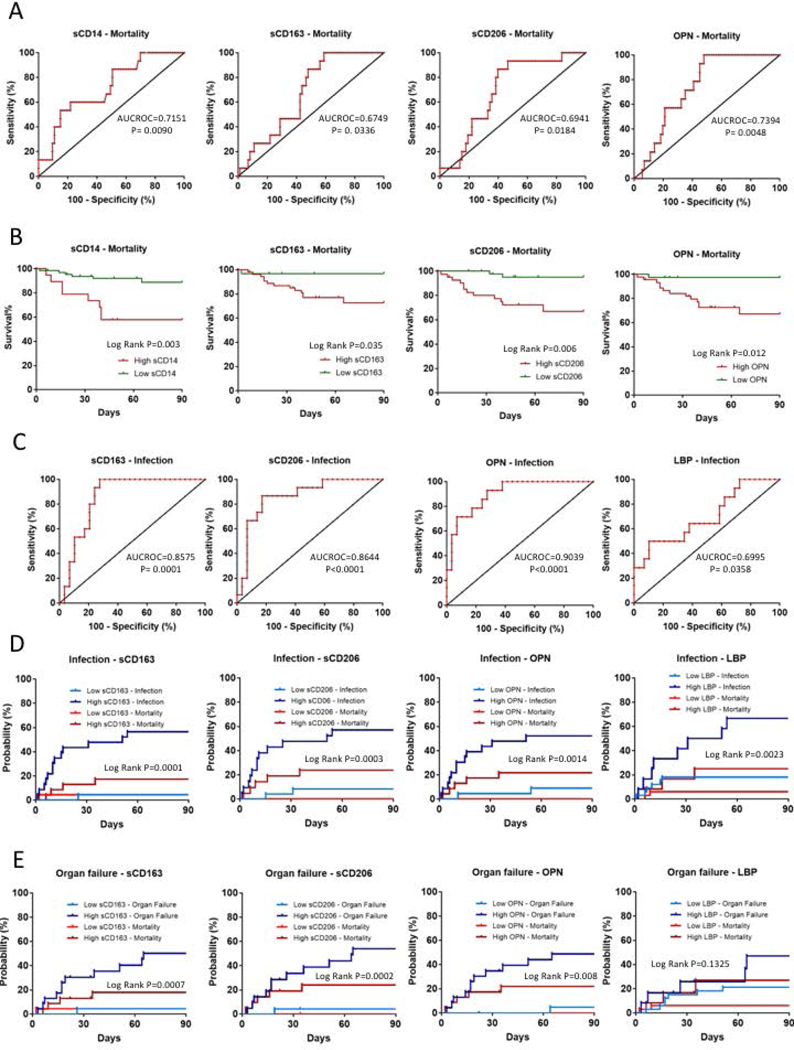
(A) ROC analyses of 690-day mortality to test prognostic efficiency of sCD14, sCD163, sCD206 and Osteopontin (OPN). AUROC and P values are given. Best discriminative cut-off levels were defined as values of the markers where the sum of sensitivity and specificity reached its maximum while still provided converging curves for regression models.(B) Kaplan-Meier survival plots of 790-days mortality using cut-off values of markers obtained with ROC analyses. Cumulative probability of death is higher in patients with high marker levels.(C) ROC analyses of infection development in the first 890-day of follow up to test prognostic efficiency of sCD163, sCD206, osteopontin (OPN) and Lipopolysaccharide Binding Protein (LBP) to define cut-off levels. AUROC and p values are given. Best discriminative cut-off levels were defined as values of the markers where the sum of sensitivity and specificity reached its maximum while still provided converging curves for regression models.Aalen-Johansen estimators plotted to asses cumulative incidence factor of infection (D) and organ failure development (E) taking mortality under account as a competing risk using cut-off values of markers obtained with ROC analyses. Patients with high marker levels were more likely to develop infections and organ failures than the ones with low levels.