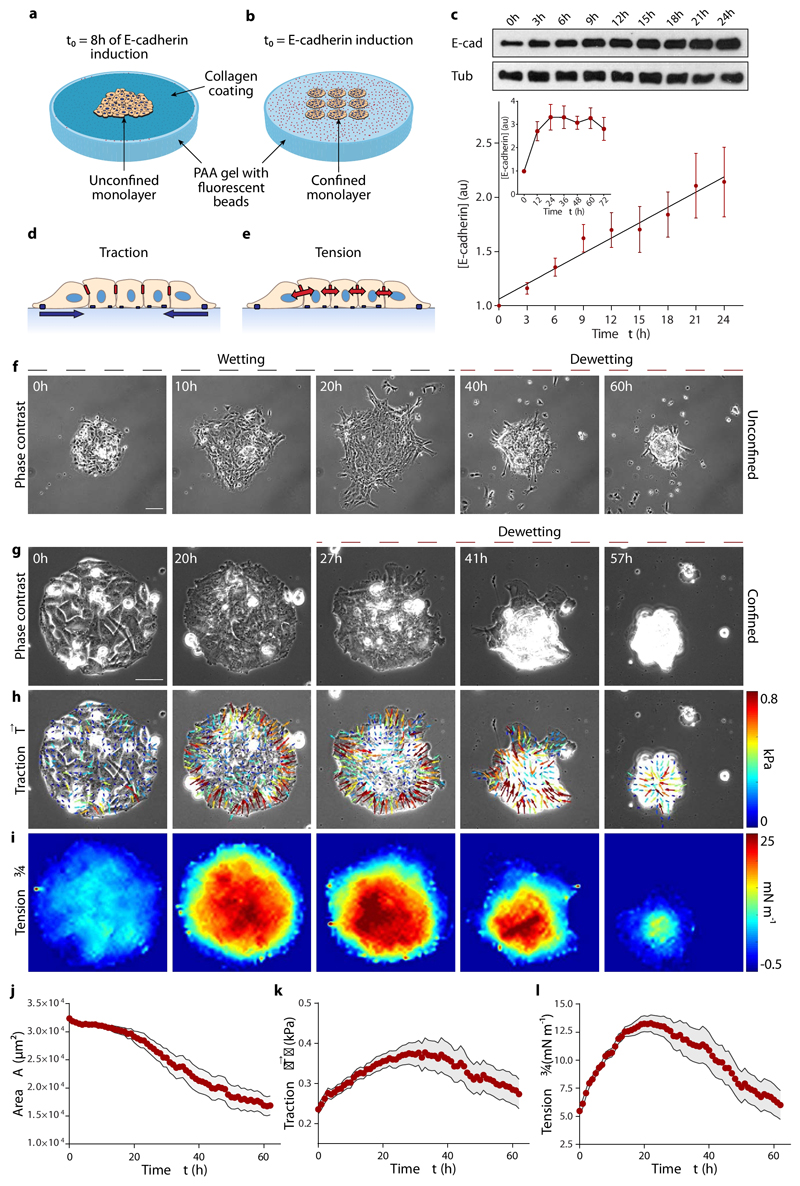
Fig. 1. E-cadherin expression causes an increase in traction forces and monolayer tension, and induces dewetting.
a,b, Scheme of the experimental setups. For spreading experiments, cells form a monolayer within the circular opening of a PDMS membrane. After 8 hours in the dexamethasone-containing medium, the PDMS membrane is removed and the monolayer spreads on the collagen-coated substrate (a). For confined monolayers, cells are seeded in circular islands of collagen on the substrate and allowed to cover them for 3 hours. Dexamethasone is then added to induce E-cadherin expression and time-lapse imaging starts (b). c, Quantification of E-cadherin upon addition of dexamethasone (inset, up to 3 days). Tub = tubulin. d,e, Illustration of traction forces (d) and monolayer tension (e). f, Spreading monolayer exhibiting a wetting transition at time t=25h. Scale bar = 100 μm. g-i, Phase contrast images (g), and maps of traction forces (h) and average normal monolayer tension (i) for a representative confined cell island of radius 100 μm. Monolayer dewetting starts at ~25 h. Scale bar = 40 μm. j-l, Evolution of monolayer area (j), mean traction magnitude (k) and mean average normal monolayer tension (l). Data are presented as mean ± s.e.m. n=18 cell islands.

