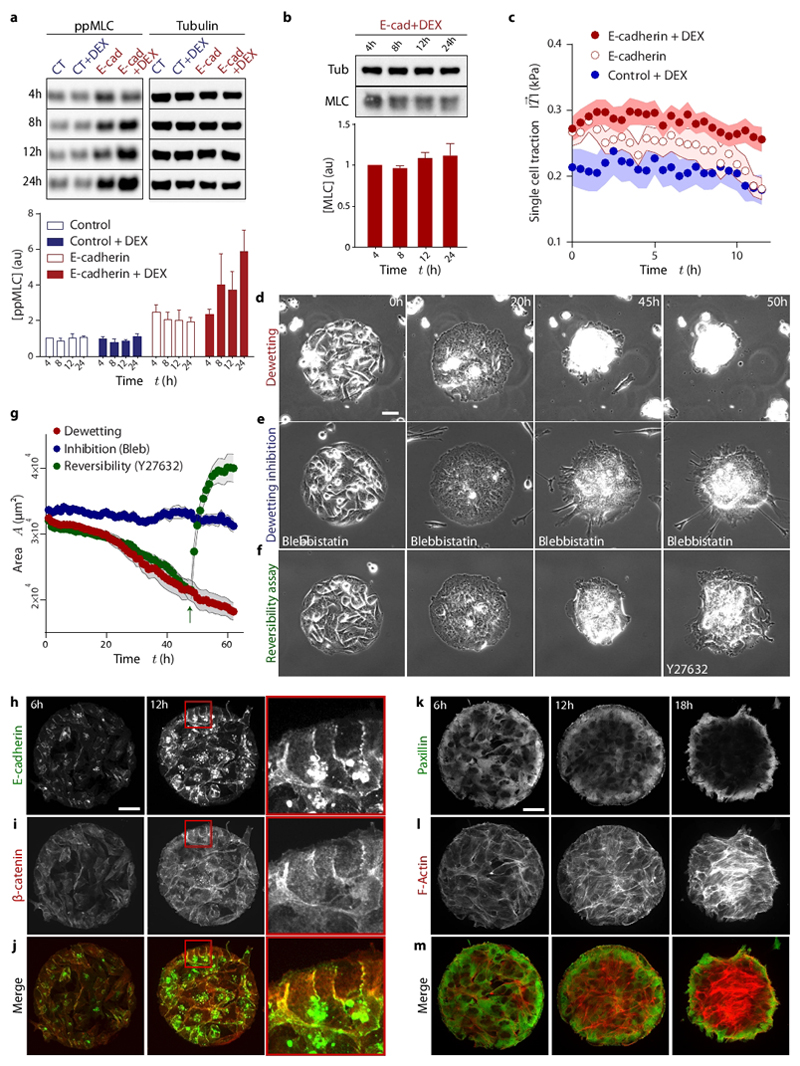
Fig. 2. Formation of E-cadherin junctions induces myosin phosphorylation, and hence the increase in tension that is responsible for monolayer dewetting.
a, Evolution of active myosin light chain (ppMLC) concentration. Control = Mock transfected cells; E-cad = cells transfected with E-cadherin under the dex-inducible promoter; DEX= treatment with dexamethasone. b, Evolution of total myosin light chain (MLC) concentration. c, Evolution of the average traction magnitude in single cells. d-f, Phase contrast images of a dewetting experiment (d), a cell island treated with blebbistatin (e) and a cell island treated with Y27632 once dewetting has started (t=46 h) (f). (g) Evolution of monolayer area for dewetting, dewetting inhibition and reversibility assays (green arrow indicates addition of Y27632). h-j, Immunostaining of E-cadherin (h), Beta-catenin (i) and merge images (j) at 6h and 12h after induction of E-cadherin expression (red square indicates the inset). k-m, Immunostaining of Paxillin (k), Actin (l) and merge images (m) at 6, 12 and 18 hours after induction of E-cadherin expression. Scale bars = 40 μm. Data are presented as mean ± s.e.m. Single cell tractions: n=24 cells. Dewetting inhibition: n=9 cell islands. Reversibility assay: n=16 cell islands.

