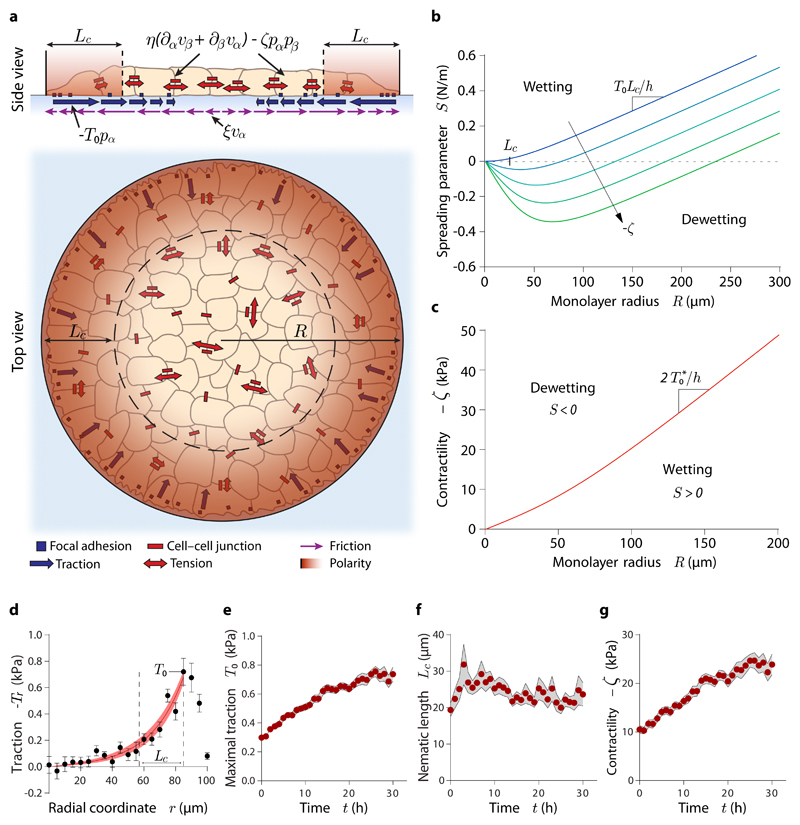
Fig. 3. Active polar fluid model of tissue wetting.
(a) Scheme of the model. (b) Spreading parameter of the monolayer as a function of its radius at increasing contractility (blue to green). The point at which S=0 indicates the critical radius for tissue wetting. (c) Predicted critical contractility for the wetting transition as a function of monolayer radius. (d) Representative example of a fit of the radial traction profile, from which we infer the evolution of the model parameters. (e-g) Evolution of the maximal traction (e), nematic length (f) and contractility (g) in islands of radius 100 μm. Data are presented as mean ± s.e.m. n=18 cell islands.

