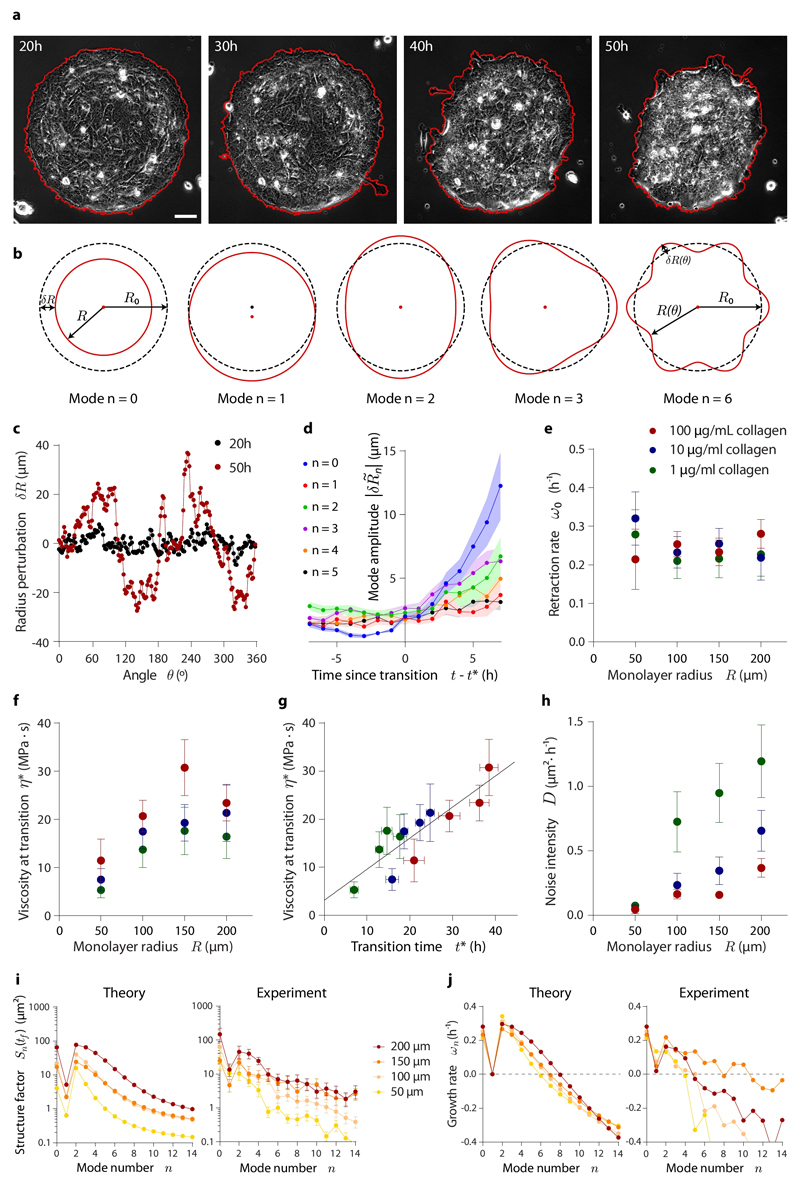
Fig. 5. Evolution of monolayer morphology during dewetting.
a, Phase contrast images of a 200 μm radius island that loses its circular symmetry during dewetting, as shown by its contour (red line). Scale bar = 30 μm. b, Illustration of the lowest shape perturbation modes of a circle. c, Initial and final radius perturbation profiles of the island shown in (a). Note that the final time point is well after the onset of dewetting, into the nonlinear regime of the instability not captured by our analysis. d, Evolution of the average amplitude of the lowest shape perturbation modes for 200 μm radius islands around the wetting-dewetting transition. e-h, Retraction rate, namely the growth rate of mode n=0 (e), monolayer viscosity at the wetting transition (f), and noise intensity of mode amplitudes (h) as a function of monolayer radius and substrate ligand density. Monolayer viscosity correlates with transition time (g). i-j, Structure factor of the monolayer boundary (i), and growth rate of shape perturbation modes (j) for islands of all different radii on substrates coated with 100 μg/mL of collagen. Theoretical predictions are shown along with average experimental data. Data are presented as mean ± s.e.m. Analyzed islands are the same as in Fig. 4, but some islands were discarded due to imperfections in the patterning introducing initial biases towards some perturbations modes (see Materials and Methods). For islands on 100 μg/mL collagen: n=12 (200 μm radius), n=9 (150 μm radius), n=16 (100 μm radius), and n=11 (50 μm radius). For islands on 10 μg/mL collagen: n=17 (200 μm radius), n=12 (150 μm radius), n=13 (100 μm radius), and n=6 (50 μm radius). For islands on 1 μg/mL collagen: n=9 (200 μm radius), n=10 (150 μm radius), n=8 (100 μm radius), and n=7 (50 μm radius).

