Fig. 3.
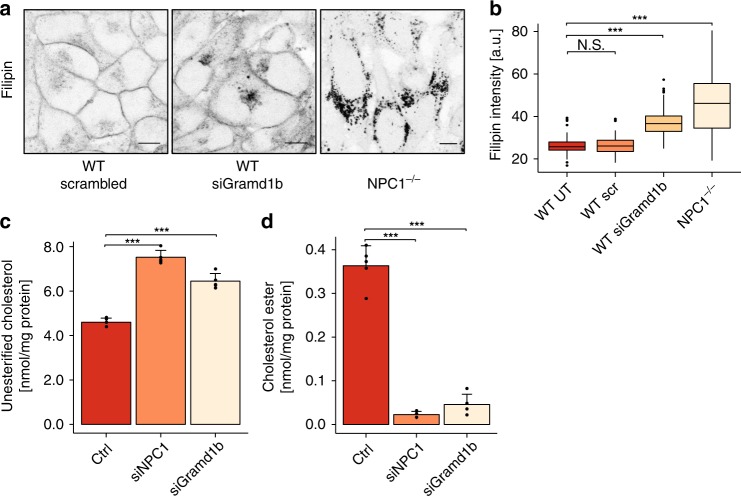
NPC1-regulated MCSs mediate cholesterol transport from late endocytic organelles to the ER. a Confocal microscopy images of WT HeLa cells transfected with control (scrambled) or Gramd1b siRNA as well as NPC1−/− HeLa cells stained with 50 µg/mL Filipin. Scale bars,10 µm. b Quantification of Filipin intensity in cells treated as described in a. Boxplots show medians as centre lines, box limits indicate first (Q1) and third quartiles (Q3), whiskers are at a maximum distance of 1.5*IQR (interquartile range) from Q1 and Q3, respectively or to the most extreme datapoint within that range. Outliers are shown. Welch two sample t-tests were performed between untreated WT condition and treatment conditions: WT-scrambled (n = 95 cells), WT-siGramd1b (n = 101 cells), NPC1−/− (n = 43 cells). N.S. P = 0.6216, ***P < 2.2 × 10⁻¹⁶, ***P = 4.9 × 10⁻¹¹. c Quantification of unesterified cholesterol in HeLa cells treated with non-targeting control (ctrl), NPC1 and Gramd1b siRNAs. Cholesterol was measured using the Amplex Red Cholesterol Assay Kit and values are presented as mean of five independent experiments + SD. Welch two sample t-tests were performed between all conditions. ctrl/siNPC1 ***P = 0.00063, ctrl/siGramd1b **P = 0.00389, siNPC1/siGramd1b **P = 0.0085. d Quantification of cholesterol esters in HeLa cells treated with control, NPC1 and Gramd1b siRNAs. Cholesterol esters were measured using the Amplex Red Cholesterol Assay Kit with addition of 0.2 U/mL cholesterol esterase. Data are represented as mean of five independent experiments + SD. Welch two sample t-tests were performed between all conditions. ctrl/siNPC1 ***P = 0.00012, ctrl/siGramd1b ***P = 0.00033, siNPC1/siGramd1b N.S. P = 0.6758

