Fig. 4.
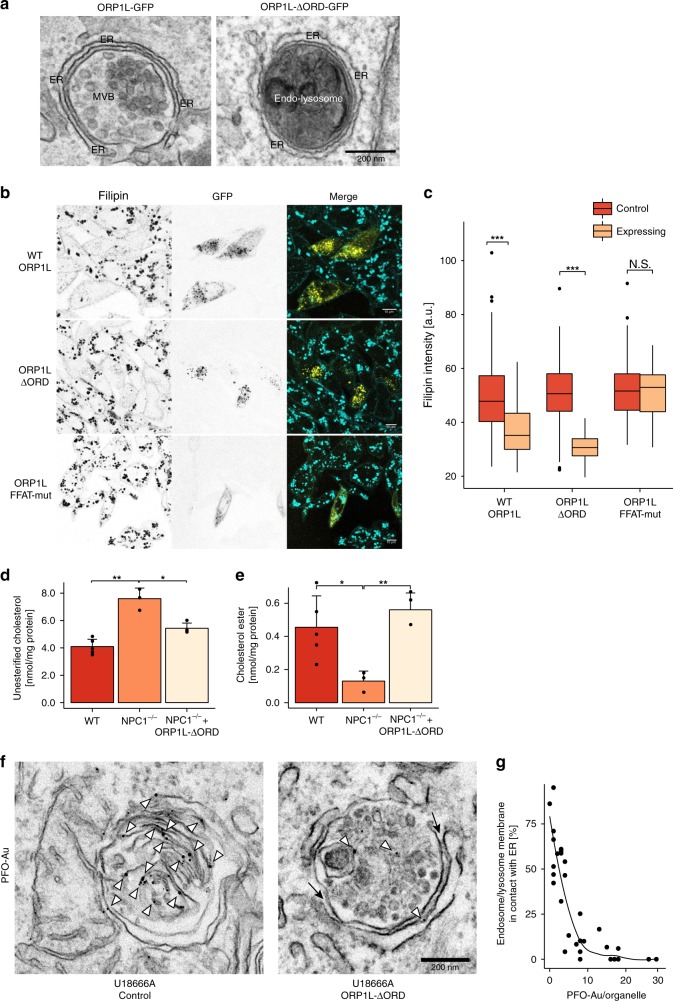
Expansion of lysosome-ER contact sites restores cholesterol egress in NPC1-deficient cells. a Electron micrographs showing extended MCSs in HeLa cells transfected with wtORP1L or ORP1L-ΔORD GFP constructs. Scale bar, 200 nm. b Confocal microscopy images of CHO NPC1−/− cells transfected with ORP1L-GFP, ORP1L-deltaORD-GFP and ORP1L-FFATmut-GFP for 24 h, fixed and stained with 50 µg/ml Filipin (GFP, yellow; Filipin, cyan). Scale bar, 10 µm. c Quantification of intracellular Filipin staining in cells treated as described in b. Centre lines show medians, box limits indicate first (Q1) and third quartiles (Q3), whiskers extend to a maximum distance of 1.5*IQR (interquartile range) from Q1 and Q3, respectively or to the most extreme datapoint within that range. Welch two sample t-tests were performed between control and expressing cells for each condition (ORP1L: n = 203 cells (Control), n = 39 cells (Expressing), ***P = 9.1 × 10⁻¹⁰, ORP1L-deltaORD: n = 204 cells (Control), n = 42 cells (Expressing), ***P < 2.2 × 10⁻¹⁶, ORP1L-FFATmut-GFP: n = 202 cells (control), n = 33 cells (Expressing) N.S. P = 0.713,). d Quantification of unesterified cholesterol in WT and NPC1−/− HeLa cells as well as in NPC1−/− HeLa cells transfected with ORP1L-ΔORD-GFP, with expressing cells sorted by FACS. Cholesterol was measured using the Amplex Red Cholesterol Assay Kit and values are presented as mean of 5 (WT), 3 (NPC1) or 4 (NPC1 + ORP1L) independent experiments + SD. Welch two sample t-tests were performed: WT/NPC1−/− **P = 0.00959, NPC1−/−/NPC1−/− + ORP1L-ΔORD *P = 0.04161. e Quantification of cholesterol esters in WT and NPC1−/− HeLa cells as well as in NPC1−/− HeLa cells transfected with ORP1L-ΔORD-GFP and sorted by FACS. Cholesterol esters were measured using the Amplex Red Cholesterol Assay Kit with addition of 0.2 U/mL cholesterol esterase. Data are represented as mean of 5 (WT), 3 (NPC1) or 4 (NPC1 + ORP1L) independent experiments + SD with asterisks indicating statistical significance as determined by Welch two sample t-tests. WT/NPC1−/− *P = 0.01547, NPC1−/−/NPC1−/− + ORP1L-ΔORD **P = 0.00104. f HeLa cells transfected with ORP1L-deltaORD were treated with U18666A (2 µg/ml for 18 h) and labelled with PFO prior to preparation for EM. Representative electron micrographs show a lysosome with little/no contact with the ER (likely not expressing ORP1L-deltaORD) staining strongly for PFO and a lysosome with an extended contact with the ER with greatly reduced PFO labelling. Scale bar, 200 nm. g The percentage of endocytic organelle membrane in contact with the ER in f was measured and plotted against the number of PFO-gold particles (cholesterol label)/endocytic organelle (n = 30 organelles)

