Fig. 5.
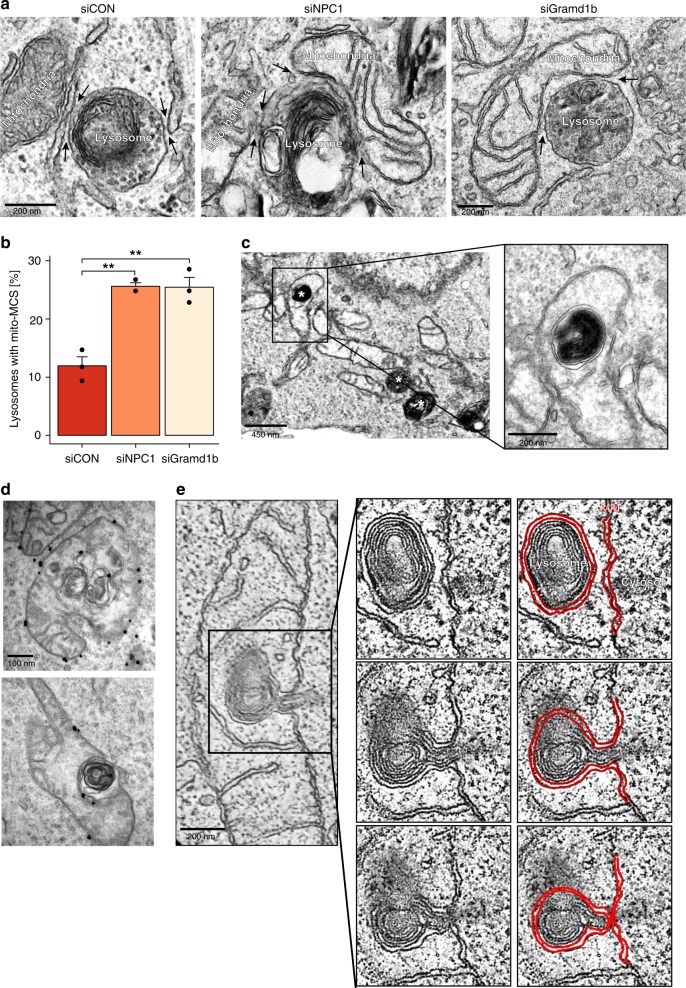
Increased lysosome-mitochondria contact sites in NPC1-deficient cells. a Electron micrographs of HeLa cells treated with non-targeting control siRNA (siCON), NPC1-siRNA (siNPC1) or with Gramd1b-siRNA (siGramd1b) showing lysosome MCSs (black arrows) with ER in control or mitochondria in NPC1 or Gramd1b-depleted cells. Scale bar, 200 nm. b The percentage of endocytic organelles with a mitochondria MCS from a were quantified and expressed as the mean of three independent experiments + SEM. Welch two sample t-tests were performed between siCON and treatment conditions (siNPC1:**P = 0.00615, siGramd1b:**P = 0.00412). c Electron micrograph of HeLa cells pulsed with HRP for 2 h prior to treatment with U18666A (2 µg/mL for 18 h). Asterisks indicate HRP-containing organelles, identified by the electron-dense reaction product. Scale bar, 450 nm and 200 nm in boxed enlargement d Representative electron micrographs of HeLa cells treated with U18666A (2 µg/mL for 18 h) and stained for endogenous Tom20 using pre-embedding labelling. Tom20-stained OMM appears to surround the lysosome. Scale bar, 100 nm. e Slices from a tomographic reconstruction from HeLa cells treated with U18666A (2 µg/mL for 18 h). Red lines, mitochondrial membrane. Scale bar, 200 nm

