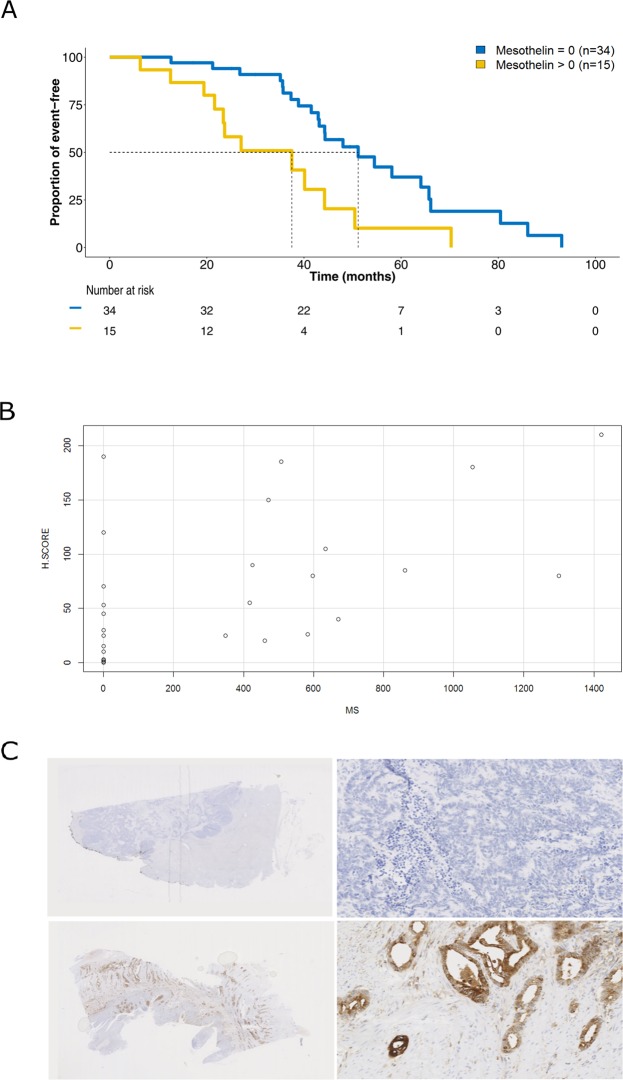
Figure 2.
Mesothelin (MSLN) expression in colorectal cancer. (A) Kaplan-Meier analysis of overall survival in the metastatic setting according to MSLN expression levels quantified by mass spectrometry (MS). (B) Correlation between MS (x-axis, amol/ug) and immunohistochemistry (y-axis, H-score). Pearson correlation coefficient, 95% confidence interval and p-value are indicated. (C) Representative immunohistochemistry staining of a MS MSLN-negative (upper panel; ID-79, liver metastasis, H-score = 0) and –positive (lower panel; ID-72, primary CRC, H-score = 210) cases. Digital magnification: 0.5 × (left) and 20 × (right).

