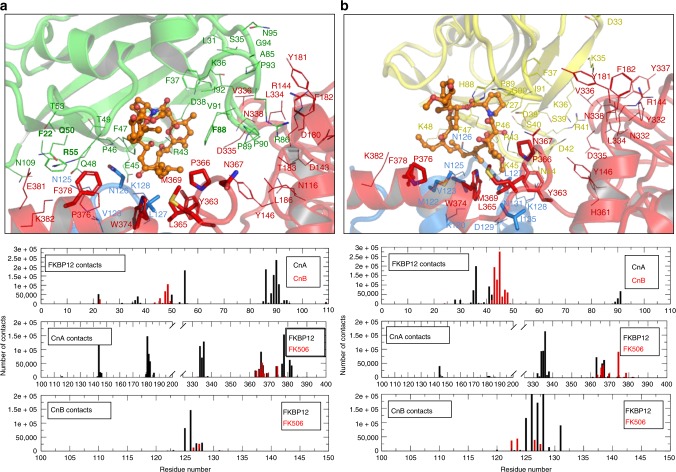
Fig. 5.
Binding of FKBP12–FK506 to A. fumigatus CN. a Cartoon representation of A. fumigatus WT AfFKBP12–FK506 complex binding to A. fumigatus CN (CnA/CnB) from the MD simulation. Cartoon representations colored as follows: CnA (red), CnB (blue), AfFKBP12 (green), and FK506 (orange sticks and spheres). b Cartoon representation of Human hFKBP12:FK506 complex binding to A. fumigatus CnA/CnB from the MD simulation. Cartoon representations colored as follows: CnA (red), CnB (blue), hFKBP12 (yellow), and FK506 (orange sticks and spheres). Residue labels are shown for clarity and colored to the same color as their protein. Residues (those with more than 2000 contacts in the last 100 ns of the simulation) depicted as lines are contacts between either FKBP12 and CnA or CnB, while sticks are contacts between FK506 and CnA or CnB. Valence states are shown for label clarity. Bar graphs denote all contacts within 6 Å during the last 100 ns of each simulation; top bar graph, FKBP12 contacts to CnA (black) and CnB (red); middle graph, CnA contacts to FKBP12 (black), and FK506 (red), slanted lines denote residues 201–324 to which there are no contacts in CnA; bottom graph, CnB contacts to FKBP12 (black), and FK506 (red). See also Supplementary Figs. 7 and 8 and Supplementary Table 2

