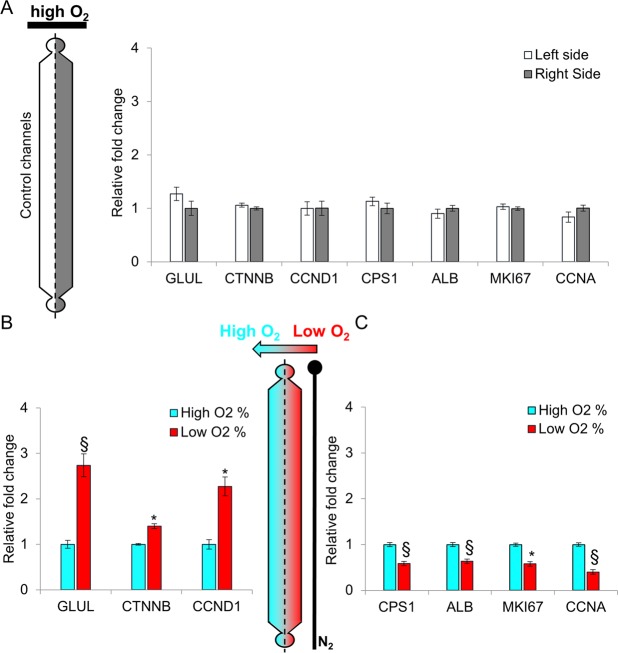
Figure 4.
Gene expression analysis in hepatocyte-like cells (HES2 line). In all panels, the levels of the target mRNA are normalized to the expression level of the 28S rRNA. (A) Real-time PCR of genes involved in metabolic and cell cycle processes in hepatocyte-like cells obtained following hESCs differentiation at uniform 21% O2 concentration (control chip). No statistical difference is observed between the right side and the left side. Data, normalized to the average of the right side, are shown as mean ± SEM. n = 3. Real-time PCR of genes involved in metabolic and cell cycle processes in hepatocyte-like cells grown in a stable O2 gradient generated by the microfluidic device. (B) GLUL (glutamine synthetase), CTNNB (beta-catenin) and CCND1 (cyclin D1) show significantly higher expression in low pO2. (C) CPS-1 (carbamoyl-phosphate synthetase 1), ALB (albumin), MKI67, CCNA (cyclin A) show significantly higher expression in high pO2. Data, normalized to the average of 21% O2, are shown as mean ± SEM. n = 9. p* < 0.001 and p§ < 0.0001 respect to 21% O2.

