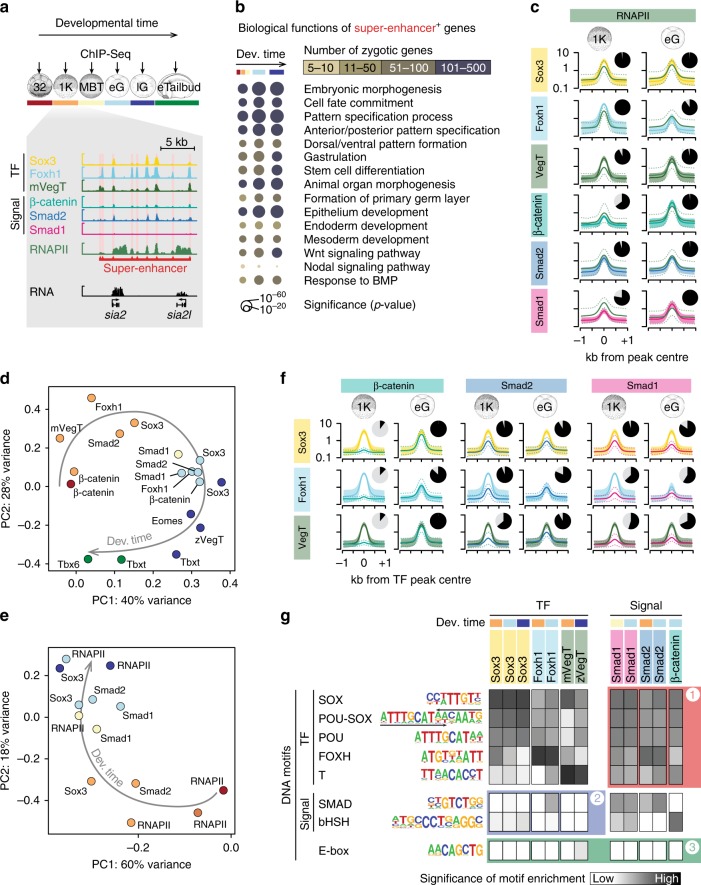
Fig. 3.
Chromatin engagement of TFs and signal mediators during the maternal-to-zygotic transition. a Chromatin profiling (ChIP-Seq) of selected TFs and signal mediators from the 32- or 1024-cell stage (32, 1 K) to the early (eG) and late (lG) gastrula and the early tailbud (eTailbud) stage. In all subsequent figure panels, the chromatin factors and developmental stages profiled are consistently colour-coded as illustrated here. The excerpt of multiple chromatin tracks shows the binding of maternal TFs (Sox3, Foxh1 and VegT) and signal mediators (β-catenin, Smad2 and Smad1) to the siamois2 (sia2 and sia2l) super-enhancer at the 1024-cell stage (see Supplementary Fig. 3a for the temporal progression of chromatin engagement to the siamois2 and ventx super-enhancers). b Bubble plot shows significantly enriched biological processes associated with zygotic super-enhancer+ genes (i.e., genes possessing engaged super-enhancers ≤5 kb from their active TSS at indicated developmental stages). c, f Meta-plots (mean [solid line] ± s.d. [dotted line or polygon]) summarise the level of RNAPII (c) or signal mediator (f) engagement across 2000 pCRMs most frequently occupied by the indicated TFs or signal mediators at the 1024-cell and early gastrula stage, respectively. The pie chart next to each meta-plot shows the percentage of these TF+ or signal mediator+ pCRMs bound (ChIP ≥2x input tag density) by RNAPII or signal mediators, respectively. See Supplementary Note 1 for percentage numbers. d Biplot of principal component (PC) 1 (accounting for 40% variance) and 2 (28% variance) shows the relationship of TF and signal mediator binding levels across ∼12,500 highly engaged pCRMs (compiled from the 2000 pCRMs with the highest DNA occupancy levels detected per protein and developmental stage) over several developmental stages. Note that developmental time (arrow) separates these profiles best. e Biplot of PC1 (60% variance) and PC2 (18% variance) for the temporal progression of RNAPII and TF binding levels across the same set of pCRMs as in d. g Heat map shows the statistical significance (hypergeometric p-value) of finding TF- and signal-specific DNA consensus motifs (y-axis) across 2000 pCRMs most frequently occupied by the indicated TFs or signal mediators (x-axis)

