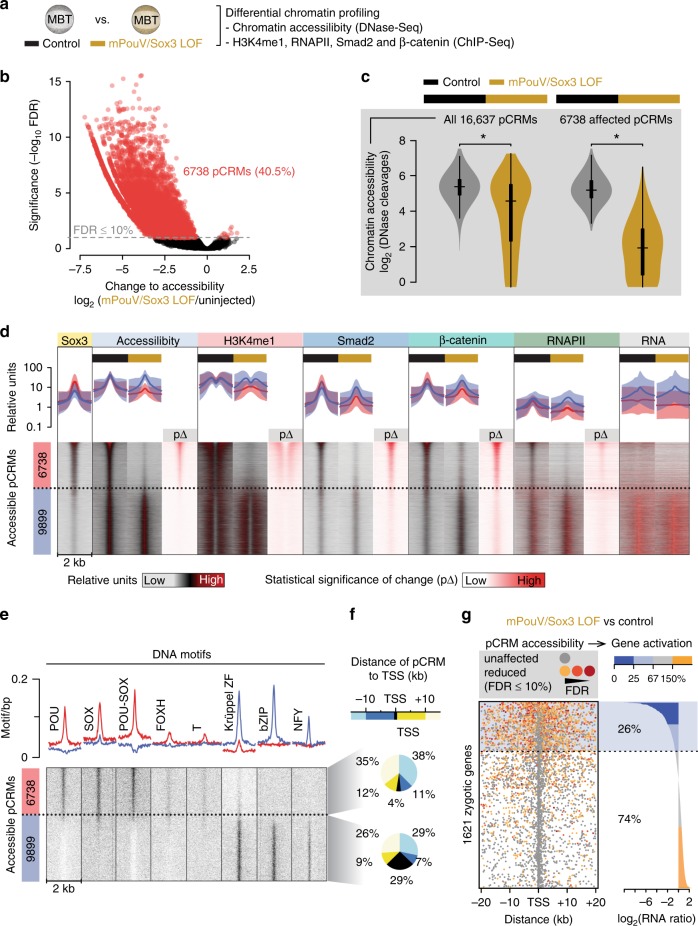
Fig. 8.
Maternal pluripotency TFs mPouV and Sox3 remodel ∼40% of the accessible chromatin landscape to contribute to ∼25% of ZGA. a Used approach to reveal the effect of mPouV/Sox3 on chromatin accessibility (DNase-Seq) and chromatin composition (ChIP-Seq) around the MBT (n = 2 biologically independent samples). b Double-logarithmic volcano plot shows massive chromatin accessibility (DNase cleavage) reductions caused by mPouV/Sox3 LOF. pCRMs (dots) with significant accessibility changes (FDR ≤10%) are marked in red. c Violin plots show the comparison of chromatin accessibility (DNase cleavages) between uninjected and mPouV/Sox3 LOF embryos at all and affected (FDR ≤10%) pCRMs. Wilcoxon test: *p < 2.2 × 10⁻¹⁶. d Normalised meta-plots (top row, mean ± s.d.) and heat maps (bottom row) show the level of chromatin accessibility, chromatin engagements and RNA across accessible pCRMs in uninjected and mPouV/Sox3 LOF embryos. RNA was profiled at and beyond the MBT as shown in Fig. 6c. In the heat map, the pCRMs are sorted and grouped by significantly reduced DNase cleavages under mPouV/Sox3 LOF: red group, affected (FDR ≤10%) and blue group, unaffected (FDR >10%). These groups are represented in the meta-plots. Each heat map under mPouV/Sox3 LOF are followed by a heat map showing the statistical significance (Wald test) of changes (p∆) caused by mPouV/Sox3 LOF. e Heat map shows the occurrence of DNA motifs at accessible pCRMs sorted and grouped as in d. f Pie charts summarise the distribution of distances (kb) to nearest zygotic TSSs of affected (top pie chart) and unaffected (bottom pie chart) pCRMs. g Panel compares the effect of mPouV/Sox3 LOF on chromatin accessibility and RNAPII-mediated gene expression. Plot to the left shows the localisation of accessible pCRMs (affected, dot coloured in orange to red with FDR decreasing from 10%; and unaffected, grey dot) relative to the zygotic TSSs that are active by the MBT92 and produce enough RNA transcripts to show significant ≥ two-fold reductions upon α-amanitin injection (Fig. 6e). Gene loci are sorted by mPouV/Sox3 LOF-induced transcript fold changes as shown in the log-scaled bar graph to the right

