Fig. 5.
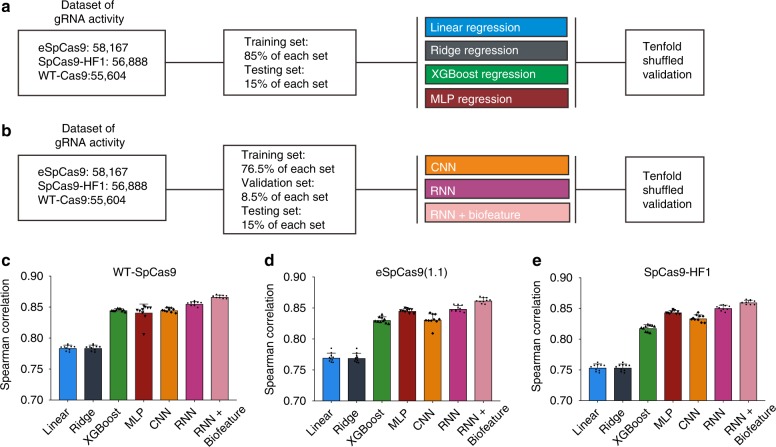
Performance of different algorithms for gRNA activity prediction. a Schematic of data set and conventional algorithms. Four conventional algorithms including linear regression, ridge regression, XGBoost regression, and MLP were constructed, respectively. In all, 85% of the relevant data set was used as the training set, and the reserved 15% of the data set in each set as the test set to measure the generalization ability of each model to predict unseen data. b Schematic of the data set and deep-learning algorithms. Deep-learning algorithms including CNN, RNN, and RNN + biofeature were constructed, respectively. In total, 76.5% of the relevant data set was used as the training set, 8.5% of the data set in each set was used as the validation set, and the reserved 15% of the data set in each set was used as the test set to measure the generalization ability of each model to predict unseen data. c–e Performance of different algorithms for gRNA activity prediction revealed by Spearman correlation for WT-SpCas9, eSpCas9(1.1), and SpCas9-HF1, respectively. The bar plot shows the mean ± s.d. for the Spearman correlation coefficient between predicted and measured gRNA activity scores (n = 10)

