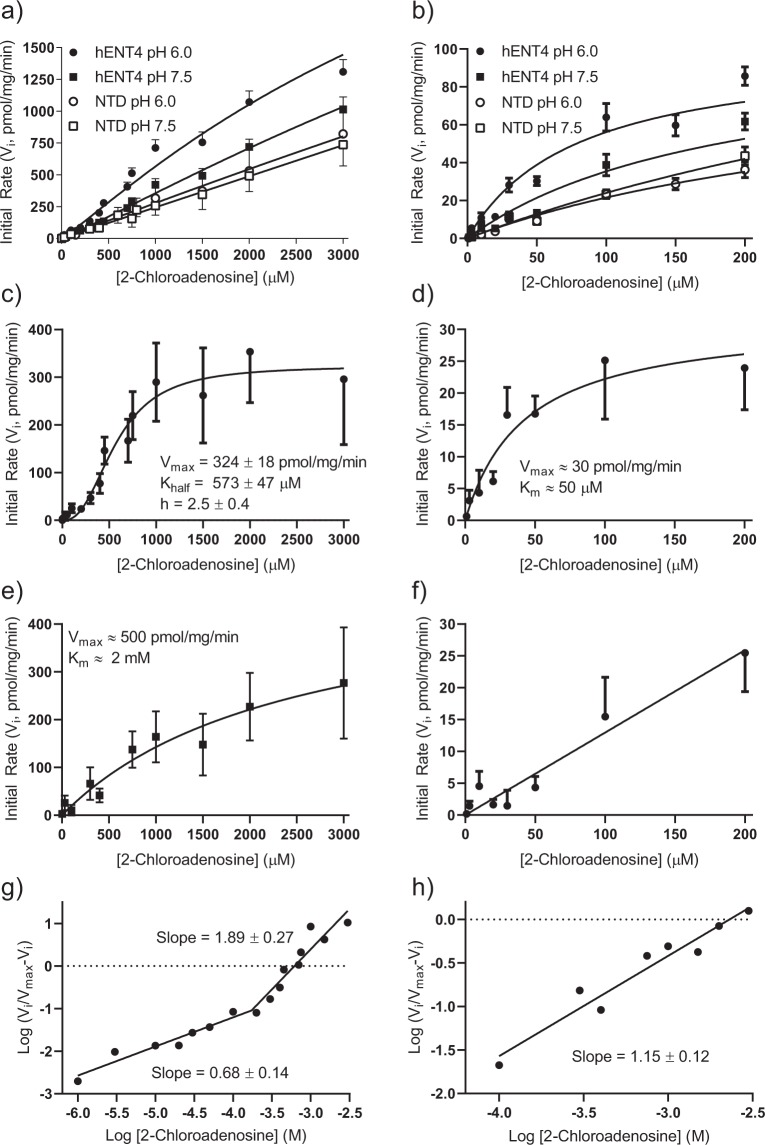
Figure 5.
Concentration-dependence of [3H]2-chloroadenosine uptake. PK15-NTD and PK15-hENT4 cells were exposed to the indicated concentrations of [3H]2-chloroadenosine for 5 min at pH 7.5 or pH 6.0, in the presence of 50 nM ABT-702. Each point represents the mean ± S.E.M of at least 6 independent experiments conducted in duplicate. Panel a shows the data for the full concentration range used. Panel b is an expanded view of the data for the concentration range of 1–200 µM from Panel a. Panel c: To assess the kinetics of the acidic pH-dependent transport component, uptake (from Panel a) by PK15-hENT4 cells at pH 7.5 was subtracted from that obtained at pH 6.0 The resulting data set was best described by an allosteric sigmoidal non-linear model with the kinetic parameters shown. Panel d is an expanded view of the data for the concentration range of 1–200 µM in Panel c. Data in this range were best described by a non-cooperative Michaelis-Menten relationship. Due to the large errors that resulted from the data subtraction, only approximate kinetic constants could be obtained in this case. Panel e: To assess the kinetics of the ENT4-mediated transport at pH 7.5, uptake (from Panel a) by PK15-NTD cells at pH 7.5 was subtracted from that using the PK15-hENT4 cells at pH 7.5. This transport component fit best to a regular Michaelis-Menten relationship. Panel f is an expanded view of the data for the concentration range of 1–200 µM in Panel e. These data were best described by a linear relationship. Panels g and h are the Hill Plot derivations of the data shown in Panels c and e, respectively. The slopes of the fitted lines, which represent the Hill coefficients, are indicated.

