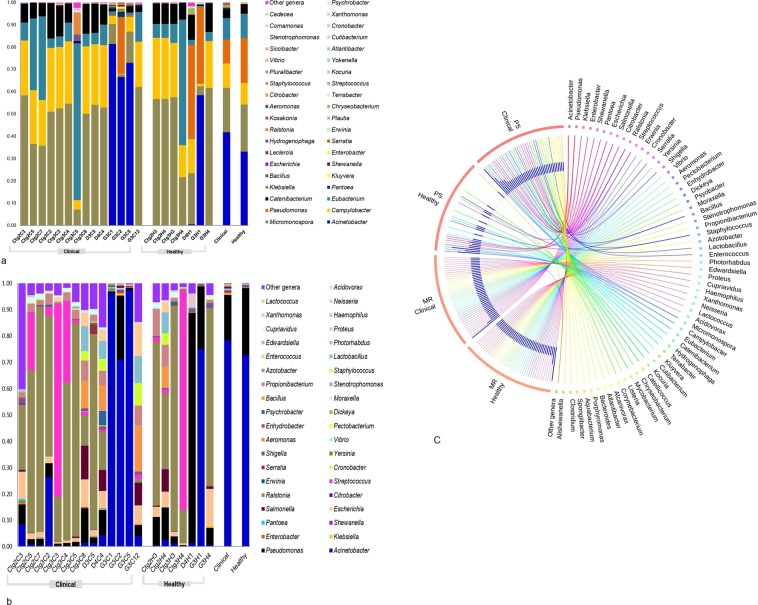
Figure 2.
Taxonomic profile of 40 most abundant bacterial genera in bovine clinical mastitis (CM) and healthy (H) milk samples. (a) Relative abundance through PathoScope (PS) and (b) relative abundance through MG-RAST (MR) analyses. The 39 most abundant bacterial genera are sorted by descending order of the relative abundance in 21samples, with the remaining genera grouped into the ‘Other genera’. Each stacked bar plot represents the abundance of bacteria in each sample of the corresponding category, where the last two bar plots depict overall relative abundance of bacterial genera between CM and H samples, respectively. (c) The circular plot illustrates the relative abundance of the top 40 bacterial genera in CM and H milk samples analysed through PS and MR. Taxa in both metagenomes are represented by different colored ribbons in both tools. The relative abundancies are illustrated by the sizes of each color segment in the outer circle and the inner blue colored bars. Part of the microbiome is shared by both sample categories (CM-H milk) and part is analytic tool specific (PS-MR). Notable differences between the bacterial populations are those where the taxon is abundant in CM samples and effectively undetected in the H milk. Sample names: suffix ending in C refers to clinical (CM) and that ending with H refers to healthy (H) milk samples.

