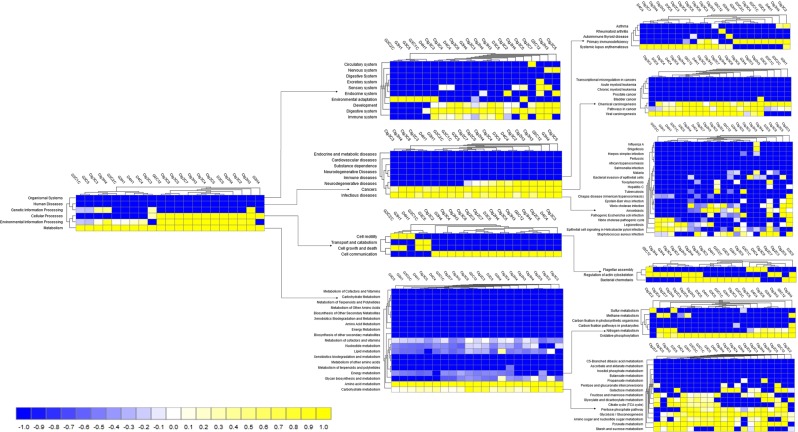
Figure 6.
Projection of the clinical mastitis (CM) and healthy (H) milk metagenome onto KEGG pathways. The whole metagenome sequencing (WMS) reveals significant differences (p = 0.001) in functional microbial pathways. Heatmaps show the average relative abundance hierarchical clustering of the predicted KEGG Orthologs (KOs) functional pathways of the microbiome across all samples. The color bar at the bottom represents the relative abundance of putative genes. The color codes indicate the presence and completeness of each KEGG module, expressed as a value between -1 (low abundance) and 1 (high abundance). The yellow color indicates the more abundant patterns, whilst blue cells accounts for less abundant KOs in that particular sample. The color bar at the bottom represents the higher relative abundance of putative genes. Sample name: suffix ends with C refers to clinical mastitis (CM) and that ends with H refers to healthy (H) milk samples.

