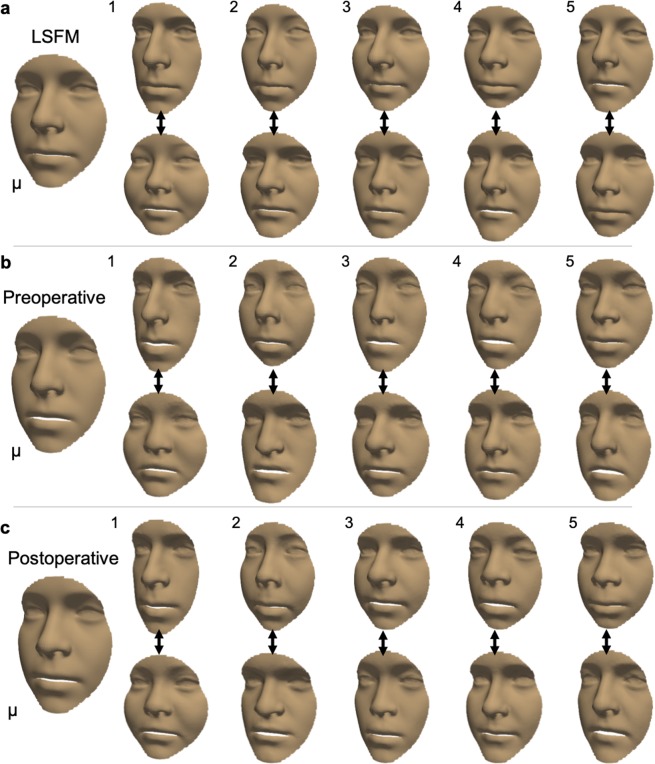
Figure 2.
Visualisation of the mean shape and variation for a non-patient face, a preoperative face, and a postoperative face. A qualitative illustration of the mean shape (μ) and first five shape eigenvectors, with weights for the standard deviation (σi) of + 3σi (top row) and −3σi (bottom row). (a) LSFM represented a non-patient population and acted as a benchmark for our models. (b) The bespoke preoperative model, constructed from preoperative 3D scans (n = 119). (c) The bespoke postoperative model, constructed from postoperative 3D scans (n = 127).

