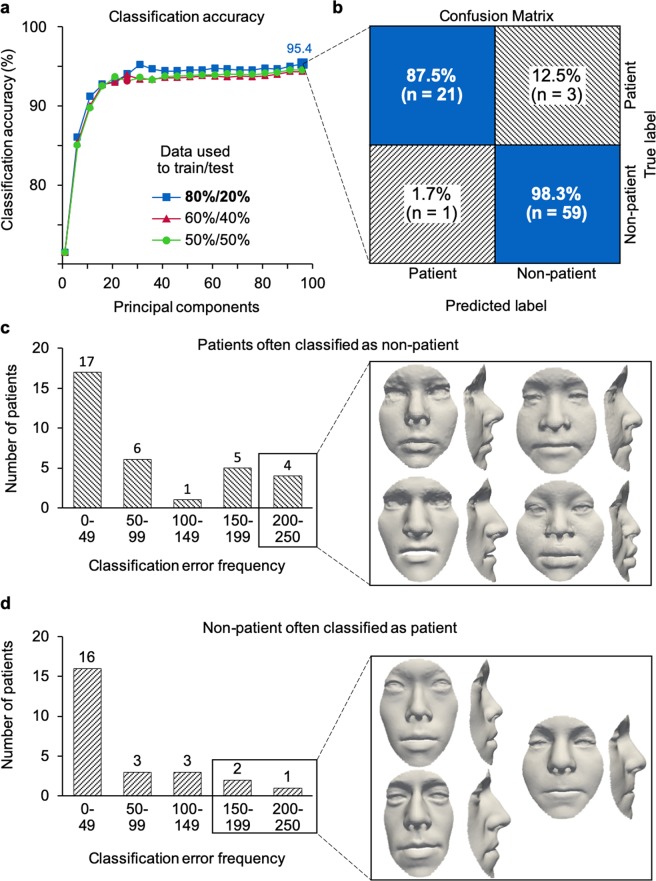
Figure 5.
Classification of preoperative patient and non-patient faces. (a) A split of 80–20% provides 95.4% classification accuracy at 96 principal components, superior to other splits. (b) Average confusion matrix, obtained from classification using preoperative patient scans (n = 140) and randomly selected non-patient scans (n = 280), representing the average of 1,000 iterations. With an 80–20% split, patient (n = 112) and non-patient (n = 224) scans were used for training and patient (n = 28) and non-patient (n = 56) for testing. Orthognathic shape features were diagnosed with 95.5% sensitivity and 95.2% specificity, and with a positive and negative predictive value of 87.5% and 98.3%, respectively. (c) For 1,000 iterations, 4 unique patient scans were classified as false positive in more than 200 out of 1,000 iterations, and (d) 3 unique volunteer scans were classified as false negative in more than 150 out of 1,000 iterations, suggestive of untreated patients in our volunteer sample.

