Figure 6.
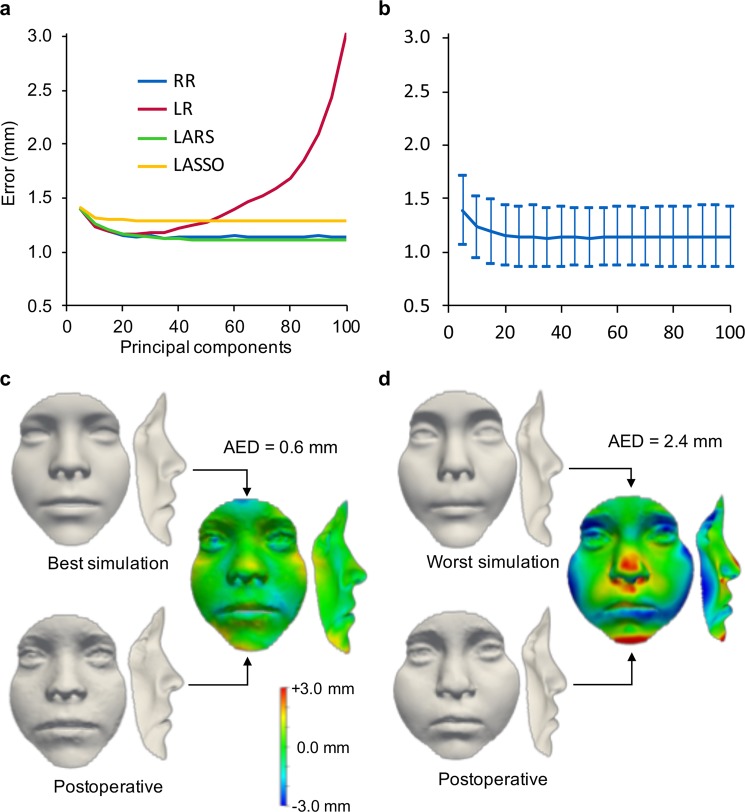
Regression for postoperative face shape simulation. (a) Overall error of the ground-truth postoperative face shape compared to the simulated shape using ridge regression (RR), linear regression (LR), least-angle regression (LARS), and least absolute shrinkage and selection operator regression (LASSO). (b) Mean and standard deviation for ridge regression: at 100 components, average Euclidean distance = 1.1 mm, s.d. = 0.3 mm. (c) The best simulated face, with an error of 0.7 mm between the simulated shape and the postoperative face shape (d). The worst simulated face, with an error of 2.4 mm as compared to the postoperative face shape.

