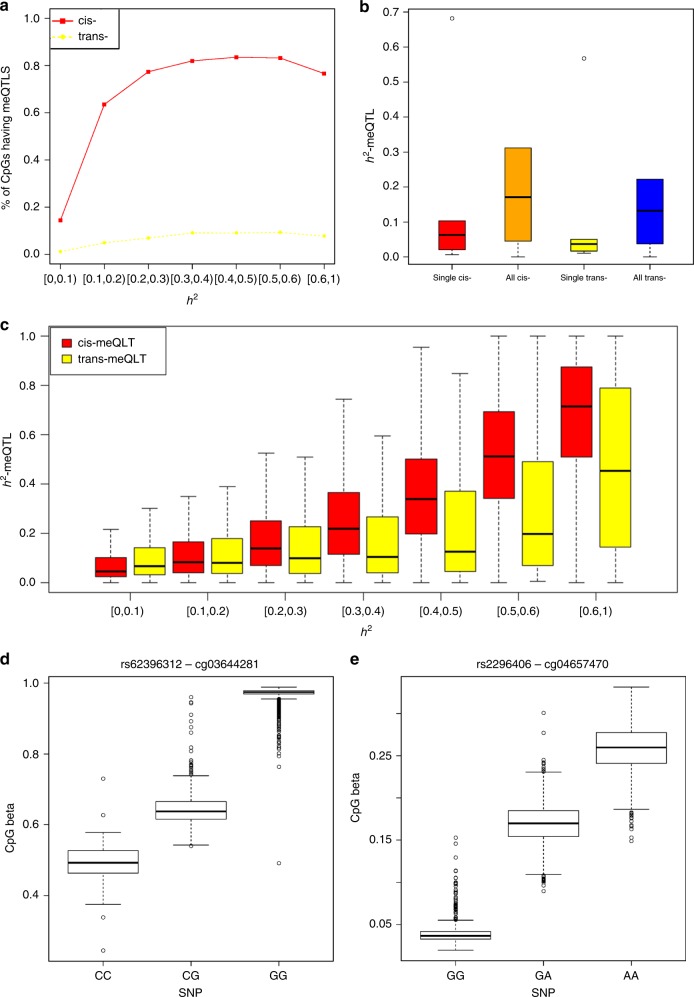
Fig. 3.
Characteristics of cis- and trans-meQTLs. a Proportion of CpGs having cis- and trans-meQTL SNPs at different levels; b Boxplot summary of estimated by the peak cis-meQTL SNP, of all cis-meQTL SNPs, the peak trans-meQTL SNP and of all trans-meQTL SNPs. For each CpG, we chose one cis-meQTL SNP with the lowest P-value for the CpG as the peak cis-meQTL SNP, and one trans-meQTL SNP with the lowest P-value for the CpG as the peak trans-meQTL SNP. c Boxplot summary of at different levels; d Boxplot of the cis-meQTL rs62396312–cg03644281; e Boxplot of the trans-meQTL rs2296406–cg04657470. Boxplots were drawn by the boxplot function in the R library. The boxes indicate the interquartile range (IQR) of values between the 75% (Q3) and 25% (Q1). The centre lines indicate the median value. The bars below and above each box indicate the data in Q1-1.5 x IQR and Q3 + 1.5 x IQR, respectively. For d, e, y-axis shows CpG methylation beta values, and x-axis shows SNP genotypes

