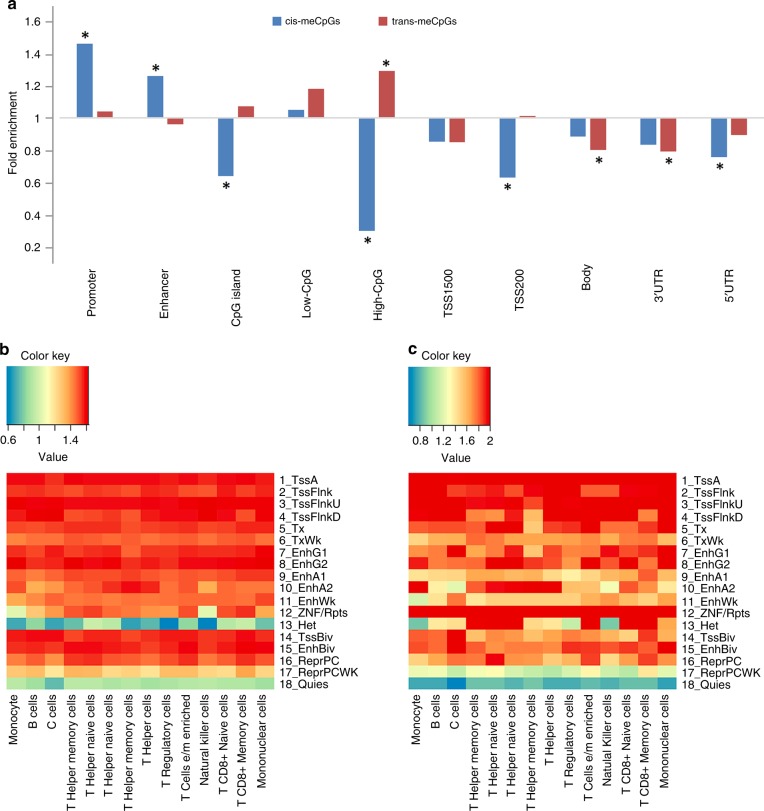
Fig. 4.
Genomic features enrichment analysis. a Enrichment of cis- and trans-meQTLs CpGs (meCpGs) in different genomic regions. Red indicated positively associated and green indicated negatively associated. * Indicate significant results with fold change > 1.2 or < 0.8, and P < 0.05/10. b Enrichment of cis-meQTL SNPs in different chromatin states in 14 blood cell lines, including monocyte, B cells, T cells, T helper memory cells, T helper naive cells, T helper naive cells, T helper memory cells, T helper cells, T regulatory cells, T cells e/m enriched, Natural killer cells, T CD8+ naive cells, T CD8+ memory Cells, and mononuclear cells; c Enrichment of trans-meQTL SNPs in different chromatin states

