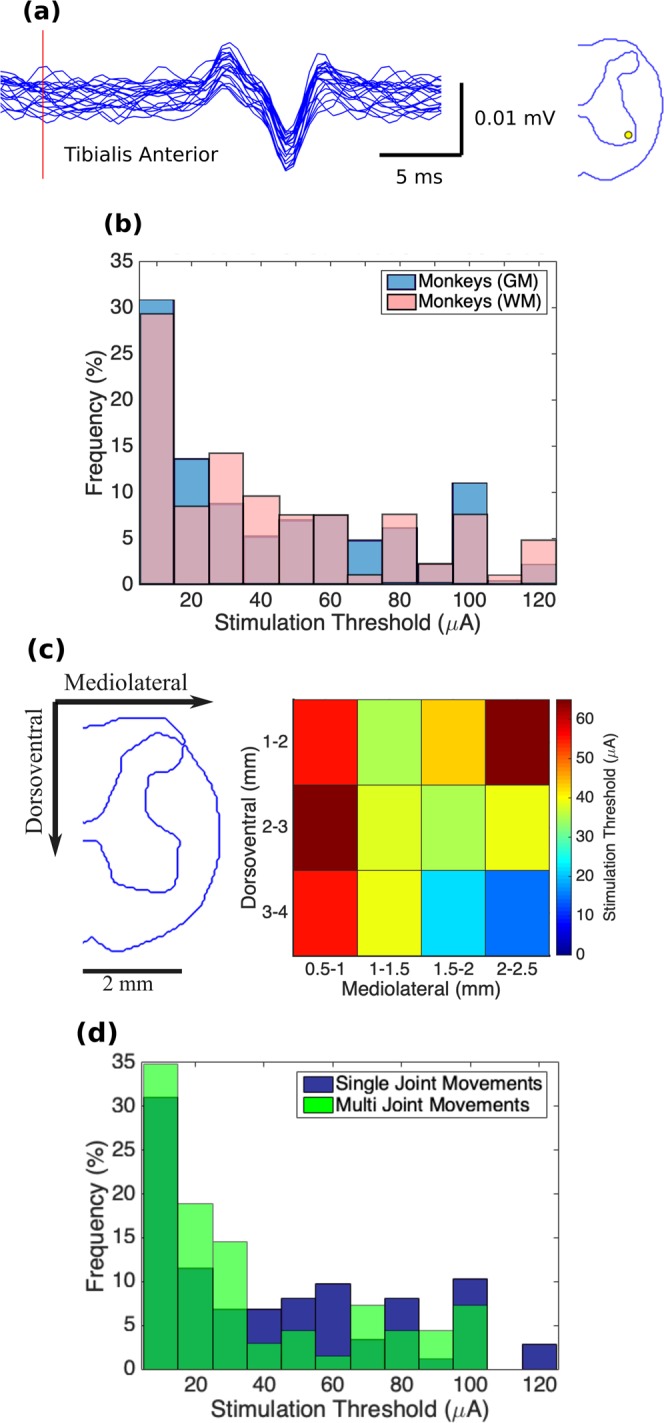
Figure 5.

(a) Example of EMG activity evoked in the tibialis anterior muscle by ISMS at threshold intensity (10 μA) in Monkey D. Red vertical line represents stimulation onset. Figure on the right shows the location of the electrode tip on a transverse cross-section of the spinal cord. (b) Distribution of the stimulation thresholds for producing leg movements in the gray (GM) and white (WM) matters (nGM = 227 and nWM = 106) of the spinal cord (n = 4 animals). (c) Spatial distribution of the stimulation thresholds. Colors in each bin represent the mean threshold across all animals. Mediolateral coordinates are shown with respect to midline. Dorsoventral coordinates are shown with respect to the dorsal surface of the spinal cord. (d) Comparison of the stimulation thresholds for single- and multi-joint movements evoked by ISMS. Distribution of the stimulation thresholds for single-joint (n = 174) and multi-joint (n = 69) movements evoked by ISMS in the spinal cord of 4 animals.
