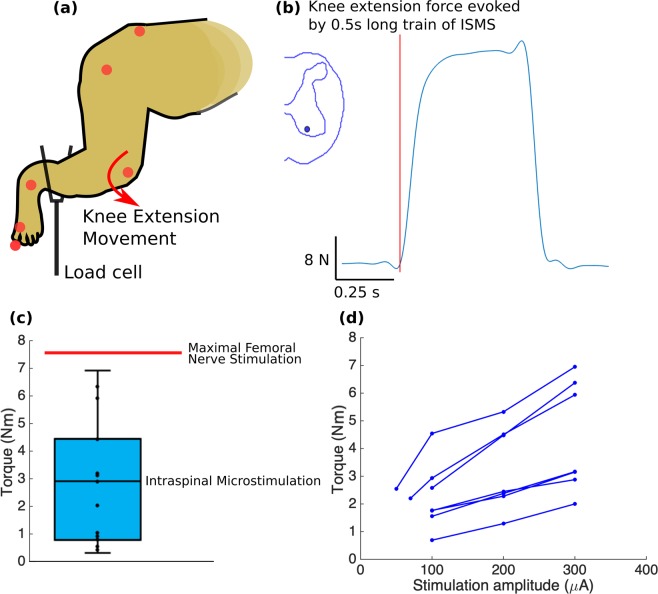
Figure 8.
(a) Isometric torque measurement setup. (b) Example of a force trace for an ISMS-evoked knee extension movement, recorded using the load cell. (c) Isometric torque measurements for knee extension movements evoked at 15 select locations across 4 animals. Whiskers show the minimal and maximal values and box represents the interquartile range. Moment arm was 15.9 ± 1.1 cm (average ± standard deviation). Knee extension torques produced with ISMS in the gray matter of the spinal cord (in cyan) and with femoral nerve stimulation (n = 1 recording - red horizontal line) are shown. (d) Knee extension torque recruitment curves recorded for 7 locations in the gray matter of the spinal cord in animals B and C. The stimulation protocol consisted of 0.5 s-train of biphasic, charge-balanced pulses, 200 µs-long and delivered at 50 Hz frequency.

