Fig. 2.
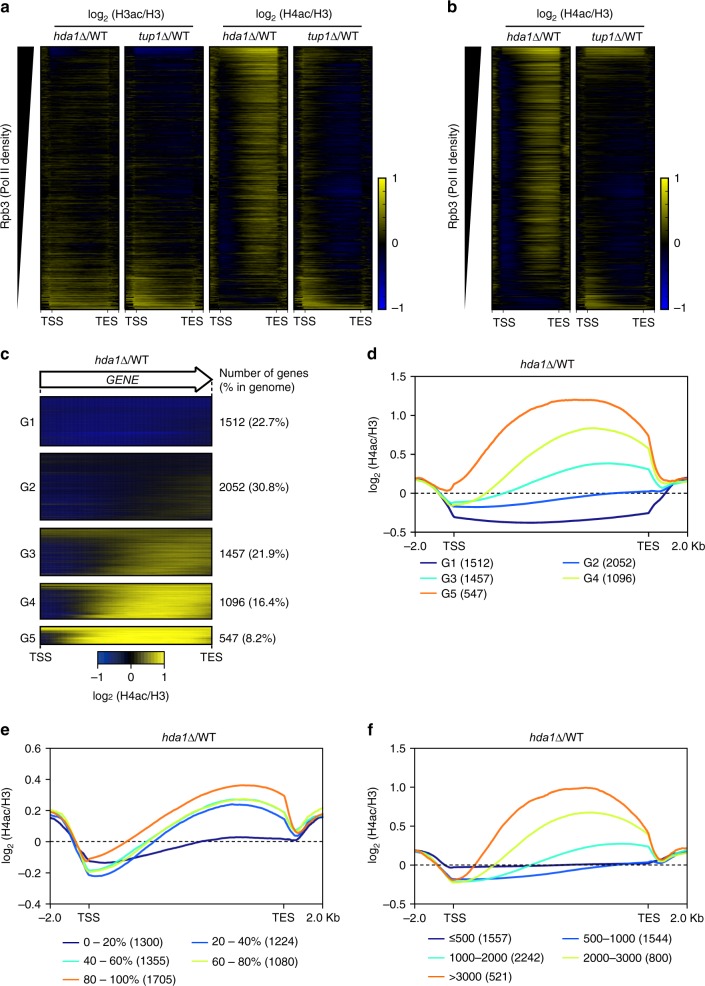
Actively transcribed long genes are preferentially deacetylated by Hda1C. a Hda1, but not Tup1, deacetylates histone H4 within coding regions. Heatmaps of H3 and H4 acetylation levels calculated as the log2 fold change in hda1∆ or tup1∆ cells versus wild-type cells from two independent ChIP-seq experiments. All genes are sorted by descending order of Rpb3 occupancy from Mayer et al.45. The y axis indicates each gene and the x axis indicates relative position to the transcription start site (TSS) and transcription end site (TES). b Confirmation of H4-specific deacetylation by Hda1C. Heatmaps of H4 acetylation levels calculated as in a from two independent ChIP-seqs including S. pombe chromatin as spike-in controls. All genes are sorted by descending order of Rpb3 occupancy. The y axis indicates each gene and the x axis indicates relative position to the transcription start site (TSS) and transcription end site (TES). c Heatmaps of H4 acetylation patterns for five gene groups identified by K-mean clustering using ChIP-seq data from b. The number of genes and % in genome are indicated on the right. d Average plot of the data shown in c. The x axis indicates relative position to the transcription start site (TSS) and transcription end site (TES). The number of genes is indicated in the parenthesis. e Actively transcribed genes exhibit a marked increase in H4 acetylation upon deletion of HDA1. Average plot of histone acetylation patterns based on RNA Pol II occupancy (Rpb3). The “0–20%” group includes genes showing the lowest Rpb3 occupancy and the “80–100%” group includes genes with the highest level of Rpb3 binding. f Longer genes show a larger increase in H4 acetylation than shorter genes upon deletion of HDA1. The plot shows average histone acetylation patterns grouped by gene length

