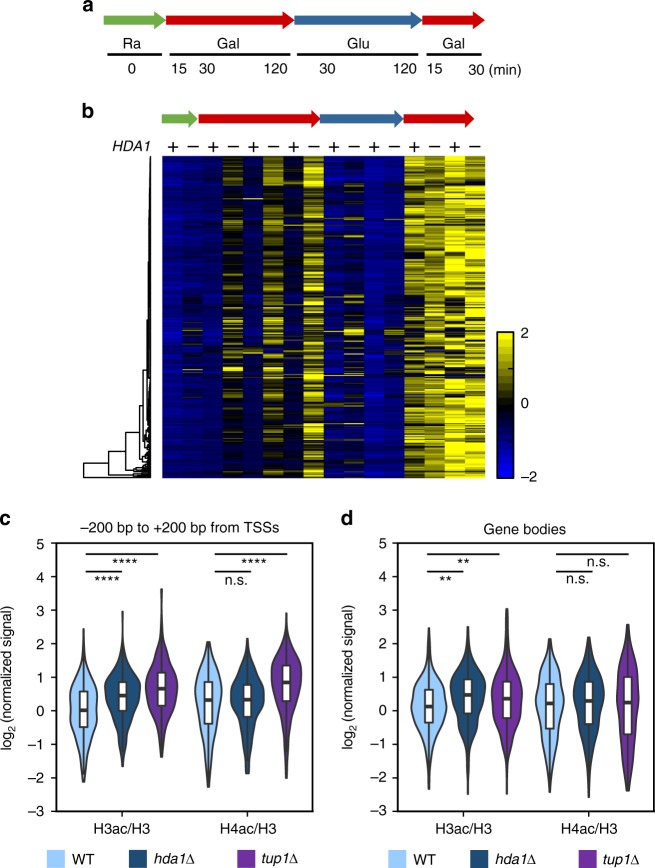
Fig. 6.
H3 deacetylation by Hda1C fine-tunes the kinetics of gene induction. a Schematic representation of the time-course experiments to monitor gene expression changes in wild-type and hda1∆ cells during carbon source shifts. Ra, raffinose; Gal, galactose; Glu, glucose. RNA samples were collected at the indicated time-points. b Hda1C negatively regulates the kinetics of gene induction. RNA samples from the time-course experiments described in a were analyzed by strand-specific RNA-sequencing. The ratios of transcript levels for 331 genes in hda1∆ versus wild-type cells are shown. Hda1-repressed genes were identified as those showing at least a 1.7-fold increase in transcript levels at one or more time-points. c, d Hda1C preferentially deacetylates histone H3 at inducible genes. Average profiles of H3 and H4 acetylation changes upon deletion of HDA1 or TUP1 around the transcription start sites (TSSs; −200 bp to +200 bp) (c) and within gene bodies (d) of the Hda1-repressed genes. Significance levels were computed by permutation tests. **p < 0.01 and ****p < 1.0 × 10⁻¹⁰

