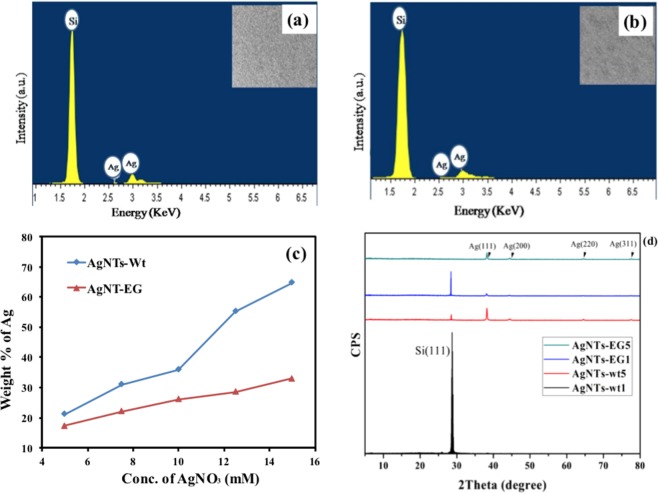
Figure 2.
EDX spectra of (a) AgNT-wt1, (b) AgNT-EG1, and (c) relationship between weight % of Ag and concentration of AgNO3 for two types of fabricated NTs, and (d) XRD patterns of AgNTs concentration. Although the (AgNTs-wt5) and the (AgNTs-EG5) samples experience Ag peaks in different orientation, it could be observed from the figure that the peak along the (111) axis is the dominating one from the XRD patterns. Hence, the long central branches obviously point to the preferred growth direction along the (111) axis. Each Nano-tree has a sharp secondary branch that has few secondary branches.

