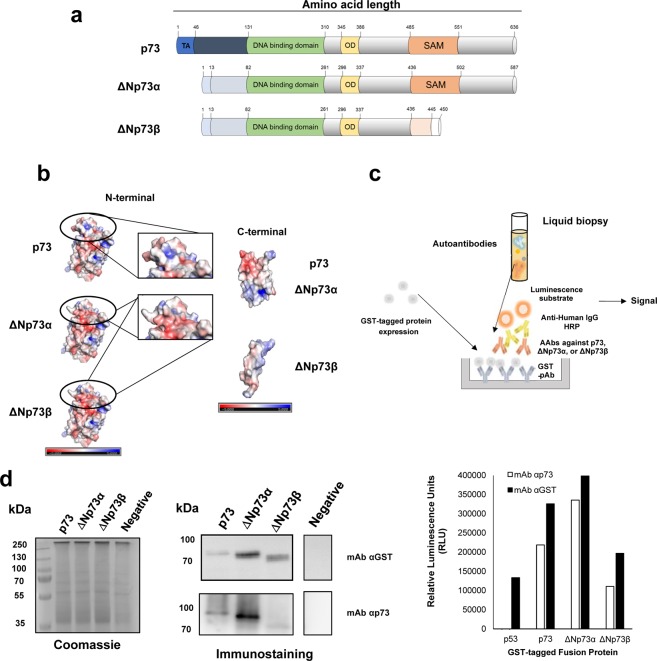
Figure 1.
Scheme of the developed approach to evaluate the humoral immune response to p73 and ∆Np73 isoforms. (a) The selected p73 isoforms for the study differ from the canonical sequence on their N-terminal end (∆Np73α), or in the N- and C-terminal ends (∆Np73β). TA, transactivation domain; OD, oligomerization domain. (b) Prediction of the 3D structure of indicated p73 proteoforms and their predicted electrostatic potential. Electropositive and electronegative charged regions are colored in blue and red, respectively. Neutral regions are colored in white. (c) For the evaluation of autoantibody levels against them, ELISA plates were coated with GST pAb to capture GST-tagged p73-family proteins. After incubation with plasma samples containing the autoantibodies followed by an anti-Human IgG-HRP antibody, a luminescence substrate is added to obtain a quantifiable signal. (d) IVTT protein expression was verified by immunostaining, and ELISA using antibodies directed against p73 or the GST-tag. For cropped WB images, expressed proteins were run in the same gel under same experimental conditions as the negative controls and processed in parallel.

