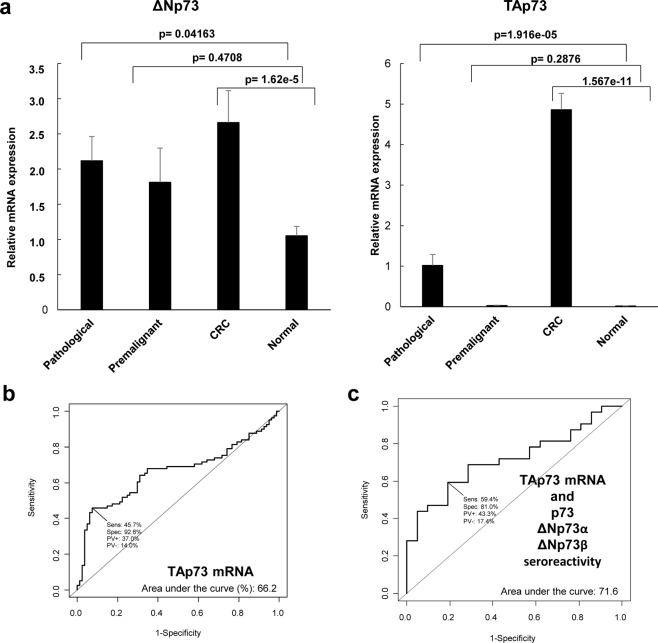
Figure 4.
Evaluation of ΔNp73 and TAp73 relative mRNA expression levels in paired normal and pathological tissue samples by qPCR. (a) For ΔNp73, relative mRNA expression 2.12 ± 0.35 (mean ± SEM) was found in pathological tissue, while values of 1.05 ± 0.13 (mean ± SEM) were found in normal tissue (p-value = 0.04163). For TAp73, relative mRNA expression of 1.02 ± 0.27 (mean ± SEM) was found in pathological tissue, while values of 0.017 ± 0.002 (mean ± SEM) were found in normal tissue (p-value 1.916e-5). Trimmed mean was used in all cases to compensate for extreme values. All measurements were taken in duplicate. (b) Assessment of the predictive value of the relative mRNA expression levels for TAp73 and ΔNp73 in tissue samples of healthy individuals vs premalignant and CRC subjects was performed through ROC curves, with only TAp73 a showing significant predictive value. (c) Evaluation of the predictive value of the combination of the seroreactivity to p73, ΔNp73α, or ΔNp73β, and the mRNA expression levels of TAp73 showed an overall AUC of 71.6%.

