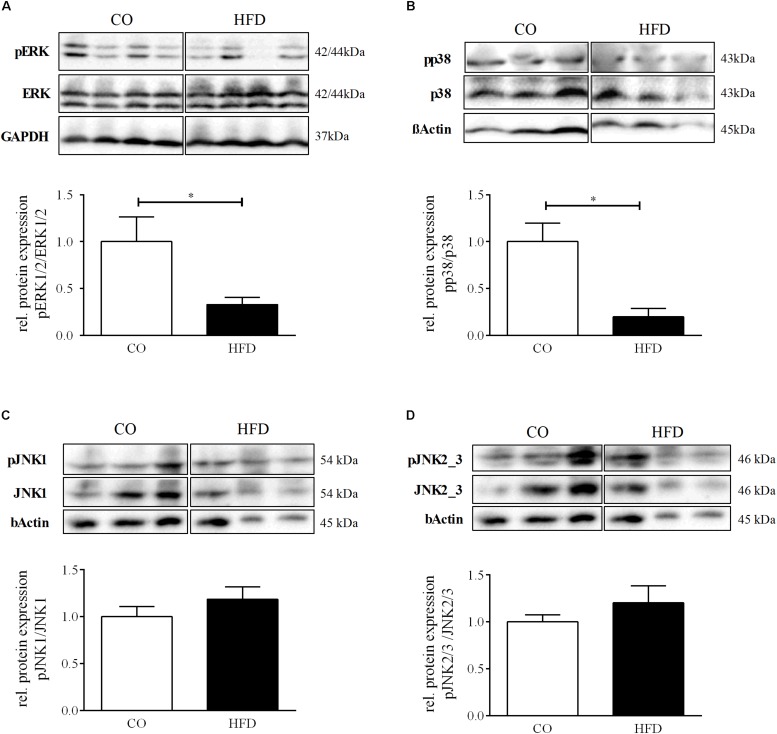
FIGURE 6.
Hypothalamic MAP kinases signaling. (A–D) Representative Western Blots of pERK, pp38, pJNK1, pJNK2/3 in hypothalamic tissue at P21. (A–D) Densitometric analysis of protein expression at P21: (A) pERK/ERK, CO n = 4, HFD n = 4. (B) pp38/p38, CO n = 4, HFD n = 4. (C) pJNK1/JNK1, CO n = 4, HFD n = 4. (D) pJNK2/3/JNK2/3, CO n = 4, HFD n = 4. Data are presented as mean ± SEM. ∗p < 0.05; CO, control; HFD, high fat diet.

