Figure 1.
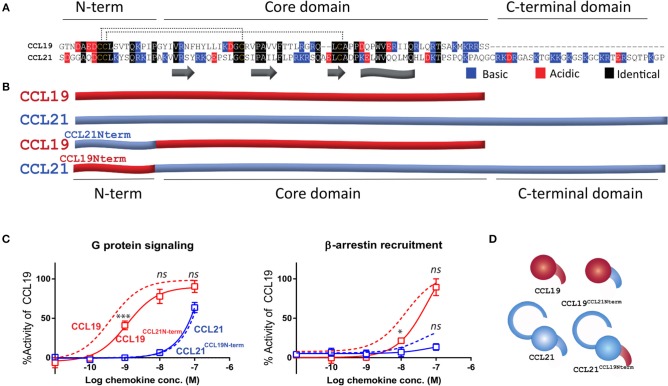
Endogenous CCL21 and CCL19 and chimeric N-terminal swap ligands. (A) Sequences of CCL21 and CCL19. The secondary structures are marked below with beta strands identified as arrows and C-terminally alpha helix identified as a sheet. N-term, core domain, and C-terminal domain refer to domains within the tertiary structure. The 16 N-terminal residues are swapped within (B). Black refers to identical residues in the two sequences, blue refers to positively charged and red refers to negatively charged. (B) Schematic overview of CCL21, CCL19, and N-terminally swapped chimeras employed in this study, CCL19CCL21N−term and CCL21CCL19N−term. Blue refers to CCL21-derived residues and red to CCL19-derived residues not to be confused with red and blue in (A). (C) Dose-response curves of CCL19, CCL21, CCL19CCL21N−term, and CCL21CCL19N−term in G protein signaling (left) and β-arrestin-2 recruitment (right). The signals are obtained by co-transfecting CHO cells with CCR7 and reporter constructs able to measure intracellular cAMP changes (G protein) or β-arrestin-2 recruitment. Data are measured as the arbitrary unit BRET ratio and normalized to that of CCL19 within each separate experiment to compensate for inter-assay variations. Signaling in response to wild type CCL21 and CCL19 are shown as dotted lines, while the curves of chimeric ligands are shown with solid lines and symbols representing mean values (±SEM). Data are represented as mean values for several independent experiments performed in duplicates (n = 7 for G protein signaling and n = 6 for β-arrestin-2 recruitment). ANOVA has been used to compare the curves of CCL19 and CCL19NCCL21N−term or the curves of CCL21 and CCL21CCL19N−term and asterisks identify significant differences, while ns refers to no significant changes. (D) Illustrative overview of wild type and chimeric ligand employed in this study with colors as described in (B).

