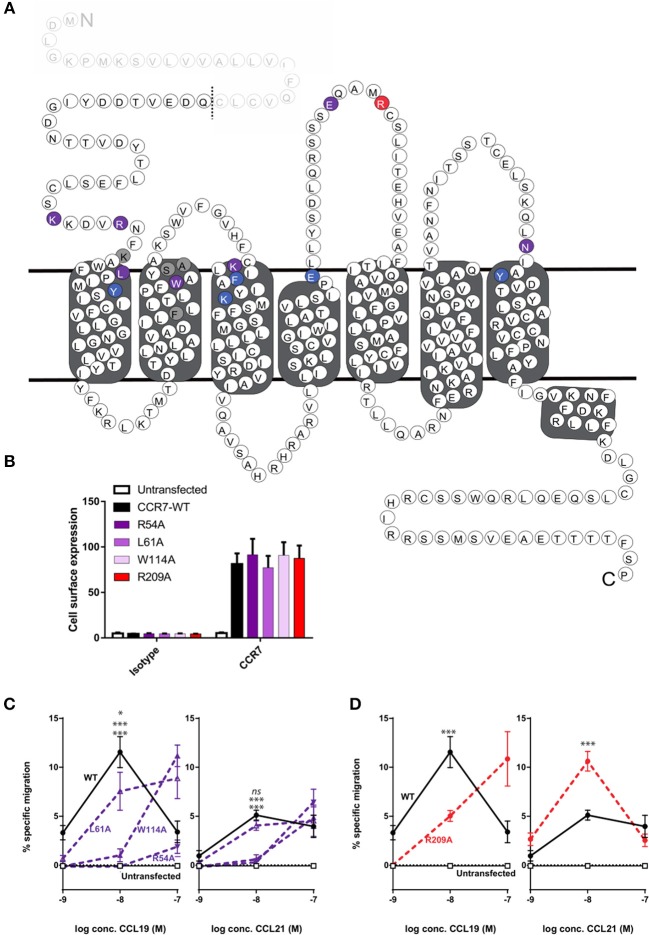
Figure 3.
Overview of mutagenesis study, surface expression, and change of CCL21- and CCL19-directed migration by CCR7 mutations. (A) Serpentine structure of CCR7 with mutations from Figure 2 identified according to effect on CCR7 signaling, purple identifies mutations impairing both ligands, blue refers to mutations only affecting CCL21, and red refers to mutations only affecting CCL19. Gray shows residue where alanine substitution did not affect signaling. The predicted 24-residues N-terminal signal sequence of CCR7 which is cleaved of from the mature protein (39) is displayed as faded and predicted cleavage site is indicated by a dotted line. (B) Surface expression levels of CCR7 were analyzed by flow cytometry in 300–19 pre-B-cells stably transfected with CCR7WT, CCR7R54A, CCR7L61A, CCR7W114A, or CCR7R209A constructs using anti-human CCR7-APC (gated on the live cell population). Data show mean APC fluorescence intensity values (±SEM) derived from all migration assays performed in (C,D). (C,D) Transwell chemotaxis in response to CCL21 and CCL19 by R54AN−term, L61A1.35, and W114A2.60 (C) or R209AECL−2 (D). 300–19 cells were allowed to migrate in response to gradient concentrations of chemokines for 180 min. Migrated cells were counted and percentages of specifically migrated cells relative to the input were calculated. Mean values (±SEM) derived from four independent experiments are shown. Asterisks identify significant differences between WT and the mutant at 10 nM chemokine calculated performing two-way ANOVA. In (C) significance levels are positioned with L61A at top, followed by W114A (middle), and R54A (bottom).

