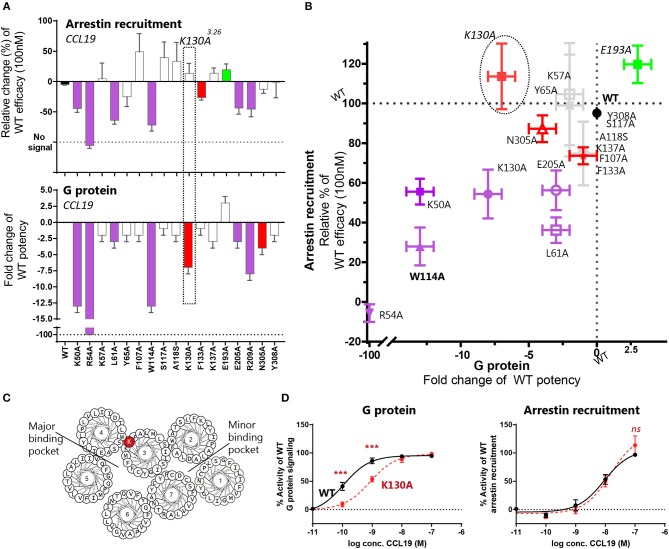
Figure 4.
Mutagenesis study of CCR7 showing changes of CCR7 G protein or β-arrestin-2 recruitment upon CCL19-stimulation. (A) Barplot displaying change of β-arrestin-2 recruitment or G protein signaling by CCR7 mutations evaluated in the BRET based assays. Changes are displayed as relative change of efficacy at 100 nM CCL19, or fold change of CCL19 potency. Colors correspond to colors in (B), where purple identifies mutations impairing both pathways, green refers to mutations improving signal, red refers to mutations only affecting one signaling pathway and gray identifies mutations with no impact. The mutation K130A3.26 selectively impairing G protein signaling is highlighted. (B) Scatterplot comparing the effect on signaling pathways. Mutations are plotted with their values from (A) and colored according to the description in (A). (C) Helical wheel showing the location of K1303.26 in CCR7. (D) Dose-response curve of K130A3.26 stimulated with CCL19 in G protein signaling assay (left) and β-arrestin-2 recruitment assay (right). Statistical differences between K130A and WT curves are analyzed by ANOVA and significant differences identified by asterisks. Data are represented as mean value (±SEM) of at least three independent experiments performed in duplicates. To compensate for inter-assay variations data has been normalized to wildtype within each separate experiment before the collection of data. The n value of independent experiments can be found in Table 1.

