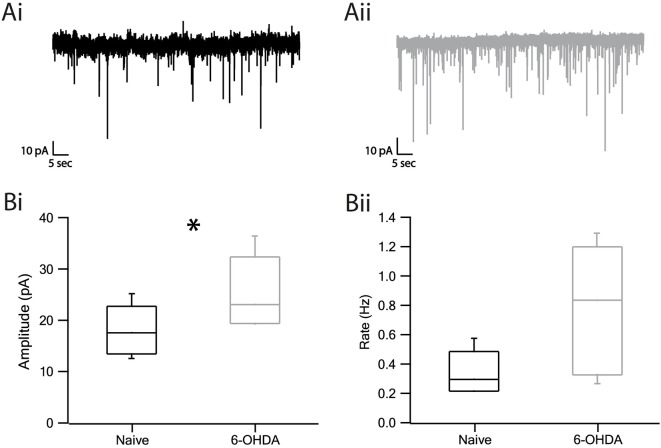
Figure 5.
Miniature IPSC amplitude and frequency increased in dopamine depleted rats. (A) Representative traces of mIPSC recordings from naïve (Ai) and parkinsonian (Aii) rats. (Bi) Amplitude of mIPSC of naïve and 6-OHDA rats. (Bii) Frequency of mIPSC. Values are expressed as the mean. *p < 0.05, Mann–Whitney U-test. The central line indicates the median, the box indicates the quartiles and the whiskers are 10 and 90% of the data.

