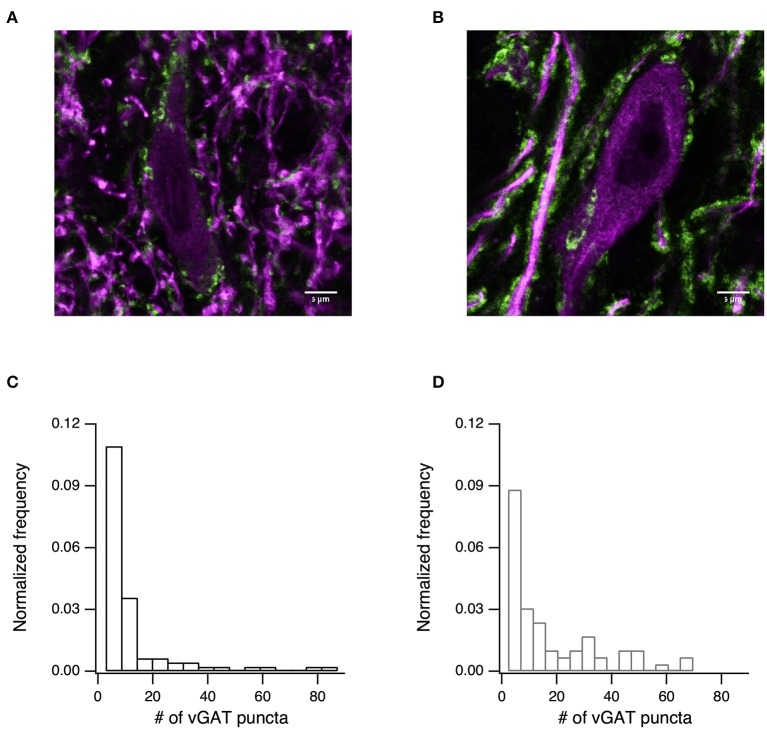
Figure 6.
The number of inhibitory terminals increased after dopamine depletion. (A) Confocal image showing immunostaining for the inhibitory presynaptic marker vGAT (green), and microtubule marker MAP2 (purple) for naïve (A) and dopamine-depleted (B) rats. Scale bar is 5 μm. (C) Histogram of the distribution of vGAT puncta counted from 84 confocal images taken from 4 naïve rats (mean ± SD: 9.6 ± 15.7 puncta/image, median 4 puncta/image). (D) Histogram of the distribution of vGAT puncta counted from 66 confocal images taken from 3 6-OHDA treated rats (mean ± SD: 15.2 ± 17.5 puncta/image, median 8 puncta/image).

