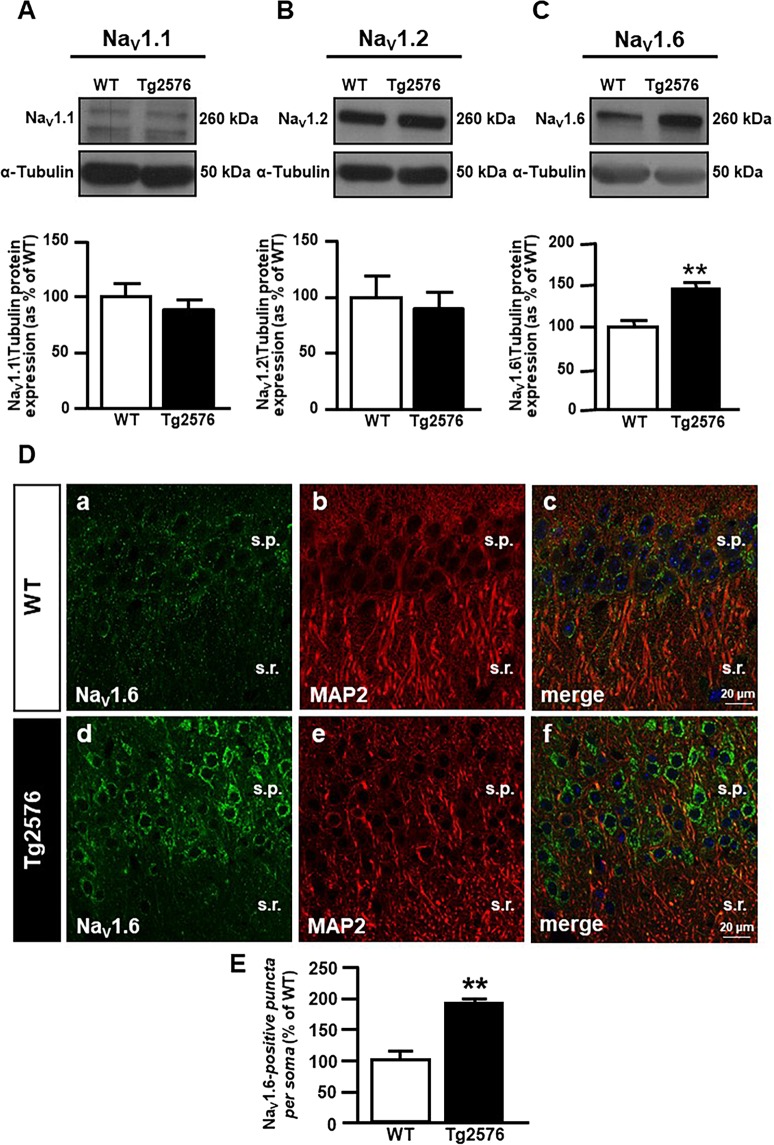
Figure 6.
Evaluation of NaV1.6 protein expression in the hippocampus of 3-month-old WT and Tg2576 mice. (A) Representative western blot (top) and densitometric quantification (bottom) of NaV1.1 protein expression in the hippocampus of WT and Tg2576 mice. Values are expressed as mean ± SEM of 3 independent experimental sessions. (B) Representative western blot (top) and densitometric quantification (bottom) of NaV1.2 protein expression in the hippocampus of WT and Tg2576 mice. Values are expressed as mean ± SEM of 3 independent experimental sessions. (C) Representative western blot (top) and densitometric quantification (bottom) of NaV1.6 protein expression in the hippocampus of WT and Tg2576 mice. Values are expressed as mean ± SEM of 3 independent experimental sessions. **p < 0.01 versus WT. (D) Confocal double immunofluorescence images displaying NaV1.6 (green) and MAP2 (red) distribution in the hippocampus of 3-month-old WT (a-c) and Tg2576 mice (d-f). Scale bars in a-f: 20 μm. (E) Quantitative analyses of NaV1.6-positive puncta within the soma of WT and Tg2576 neurons in the hippocampus of 3-month-old mice. Values are expressed as mean ± SEM of 3 independent experimental sessions. **p < 0.01 versus WT.

