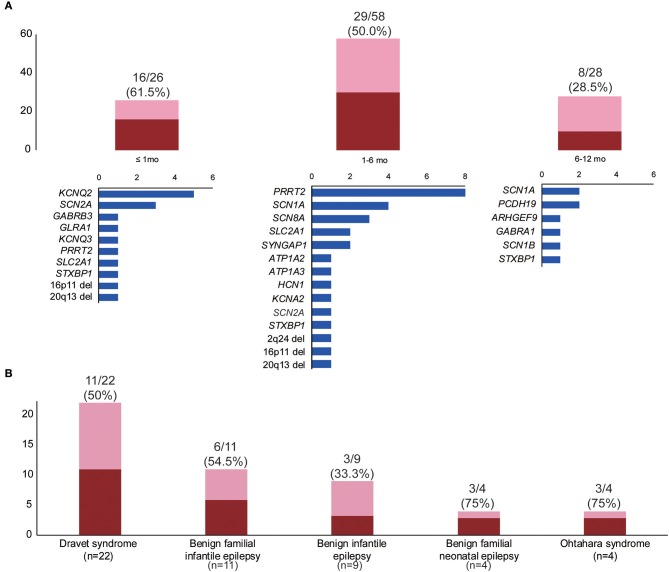
Figure 2.
Diagnostic yields by subgroups. (A) Diagnostic yields and gene frequencies according to the time of seizure onset: neonatal (≤1 mo), early infantile (1–6 mo), and late infantile (6–12 mo). (B) Diagnostic yields according to electroclinical syndrome. The blue bars in (A) indicate the number of patients in each group, with the pathogenic or likely pathogenic variants in the genes on the left. The red bar indicates the number of patients with pathogenic or likely pathogenic variants within each group. The pink bar indicates the number of patients without putative variants within each group.

