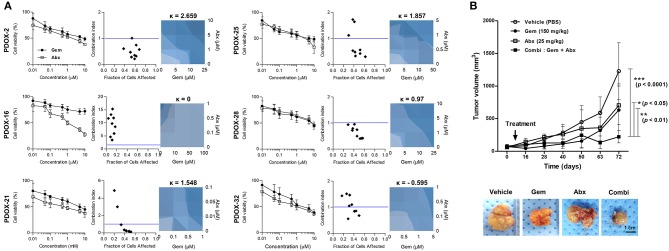
Figure 5.
Response of PDOX and PDOX-derived organoids to gemcitabine and Abraxane. (A) Response curves of patient-derived organoids to gemcitabine (left) and the combination of gemcitabine and Abraxane. The synergic effect of the combination of these two agents was assessed by comparing the effects of the combination of the two drugs with each alone using the CompuSyn program, with results reported as the combination index (CI) as a function of the fraction affected (Fa). Drug synergy was also calculated using BRAID models, with k > 0 indicating synergy, k = 0 indicating an additive effect, and k < 0 indicating drug antagonism (right-blue). Error bars indicate standard deviations (SD) and all experiments were performed in triplicate. (B) In vivo drug efficacy testing of combination therapy using PDOX models. Combination effects of gemcitabine and Abraxane were tested in PDOX-2 models. Average tumor volumes of treated groups are plotted in graph and representative tumors after treatment are shown (bottom). Vehicle; PBS, Gem; gemcitabine, Abx, Abraxane; Combi, gemcitabine plus Abraxane. ***p < 0.0001, **p < 0.01, *p <0.05. Scale bar = 1 cm.

