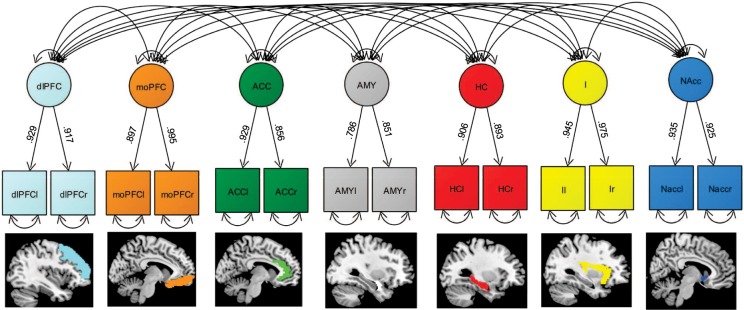
Figure 2.
A simplified illustration of the CFA of the latent brain factor model. Model fit is good (χ2 56 = 174.3, RMSEA = 0.058 (CI: 0.044–0.073); CFI = 0.979; SRMR = 0.02). Latent brain factors are drawn in circles. Squares represent observed variables. Single-headed arrows represent significant factor loadings, and double-headed arrows represent covariances. Double-headed arrows with both heads pointing on a manifest variable represent the variance of a variable.

