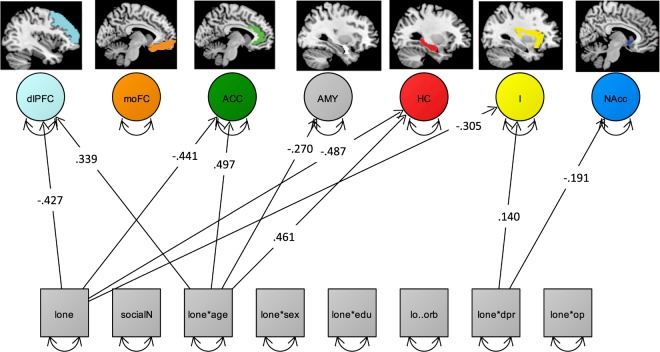
Figure 3.
Depiction of a simplified SEM (χ2 159 = 249.8, RMSEA = 0.047; CFI = 0.965) showing only all significant main effects of loneliness (lone) and number of confidants (social) as well as the interaction of age (lone*age), sex (lone*sex), education (lone*sex), morbidity (lo*orb), depression (lone*dpr) and optimism (lone*op) with loneliness, which are regressed on the intercorrelated latent brain factors (circles, intercorrelations not shown). Squares represent observed variables. Double-headed arrows with both heads pointing on a manifest variable represent the variance of a variable. Loneliness, depressive affect, openness and educations are represented as mean scores (squares). dlPFC = dorso-lateral-prefrontal cortex, mOFC = medio-orbito-prefrontal cortex, ACC = anterior cingulate cortex, AMY = amygdala, HC = hippocampus, I = insula, and NAcc = nucleus accumbens. Regression coefficients represent standardized estimates.

