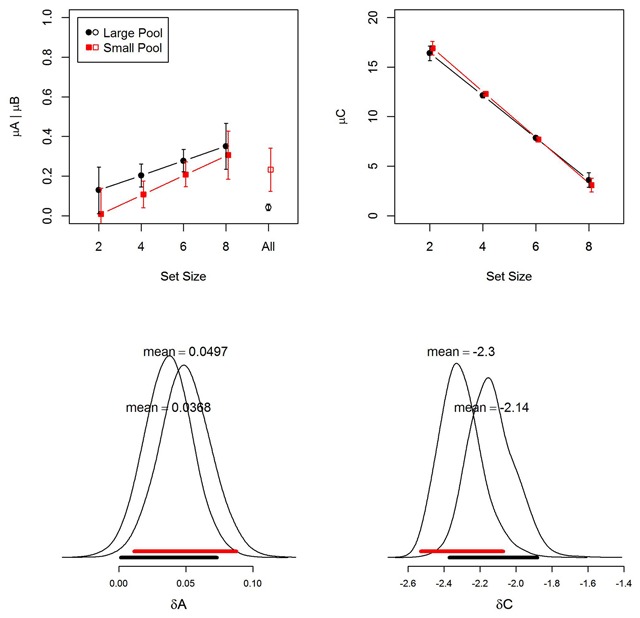
Figure 6.

Top panels: Group-level parameter estimates (means of the posterior distribution) for item memory (A) and binding memory (C) from the memory measurement model (MMM). The upper-left panel also shows the B parameter, which was the same for all set sizes (“All” on the x-axis). Black markers represent the large-pool experiment; red markers the small-pool experiment. Error bars are 95% highest-density intervals of the posteriors (Kruschke, 2011). Bottom panels: Posterior distribution of the slope of the linear effect of (mean-centered) memory set size on group means of A and C. Broad horizontal bars depict the 95% highest-density intervals (black for the large-pool experiment; red for the small-pool experiment).
