
Figure EV3. Cleavage site protection in a BS 3‐crosslinked 26S proteasome sample.
-
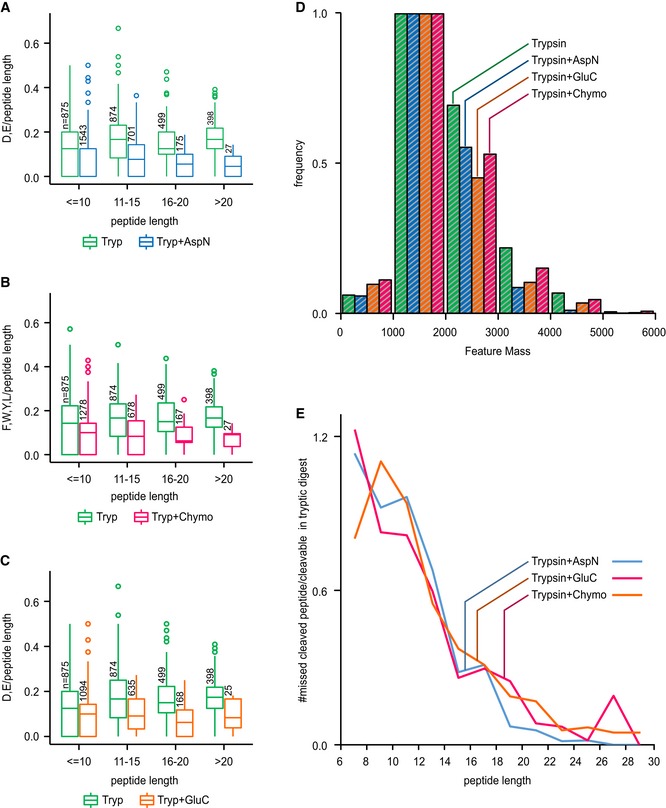
A–CWe determined the number of available cleavage sites for each secondary enzyme (A: AspN, B: chymotrypsin, C: GluC) in both the trypsin (Tryp) dataset and their respective dataset (Tryp + AspN/Tryp + Chyno/Tryp + GluC). Boxplots show that the bigger the observed peptide is, the lower is its number of remaining cleavage sites, showing that large peptides with a higher number of cleavage sites were digested. In turn, smaller peptides contain a larger density of missed cleavage sites thereby indicating that short length protects peptides from digestion. Boxplot ranges represent the 25th (lower hinge) and 75th (upper hinge) percentiles, respectively. Middle line represents the median.
-
DHistogram of intensity weighted MS features as detected by MaxQuant for each digest. The sequential digests show a slight shift to lower masses, but most observed masses are between 1,000 and 2,000 Da.
-
EProtection of peptide from secondary cleavage measured as the number of missed‐cleaved peptides in sequential digest divided by the number of peptides in the trypsin digest with potential cleavage sites for the second enzyme.