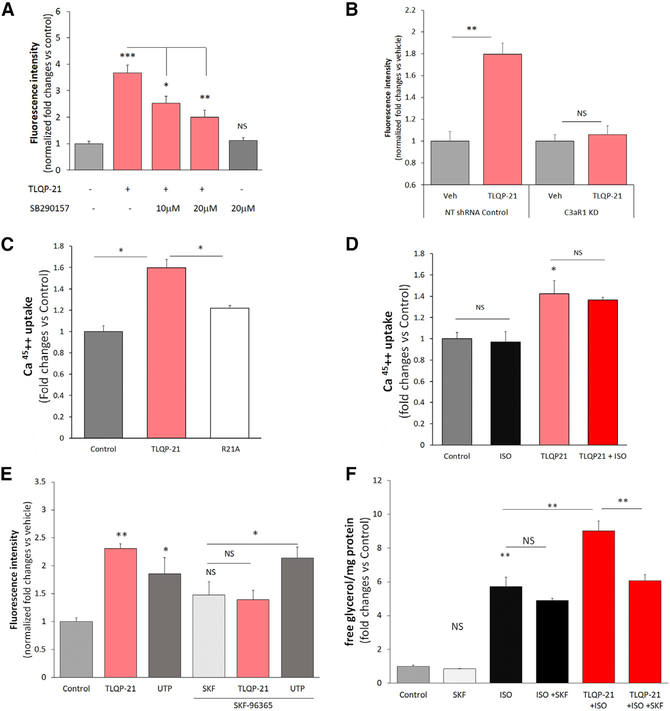
Figure 2. TLQP-21 Mediates Extracellular Calcium Influx in 3T3-L1 Cells.
(A) TLQP-21 (10 μM) increases [Ca2+]i (as measured by Fluo-4 fluorescence) during a 60-s incubation, and this effect is antagonized by the C3aR1 antagonist SB290157 (F(4,178) = 18.9, p < 0.00001, N = 25–60 cells from 2 independent experiments).
(B) TLQP-21 (10 μM) increases [Ca2+]i in non-targeting (NT) shRNA controls but not C3aR1 KD cells (F(1,102) = 17.05, p < 0.00001, N = 20–29 cells from 2 independent experiments). Additional data can be found in Figure S2C.
(C) TLQP-21 but not the R21A mutant increases uptake of Ca452+ from the medium (F(1,14) = 17.3, p < 0.001, N = 3–9 from 3 independent experiments.
(D) ISO does not modify TLQP-21-induced Ca452+ uptake from the medium (F(1,8) = 17.3, p < 0.005, N = 3).
(E) TLQP-21-induced potentiation of ISO-induced lipolysis is blocked by SKF-96365 (F(1,35) = 65.8, p < 0.0001; N = 5–6; ISO = 50 nM, TLQP-21 = 100 nM, SKF-96365 = 20 μM).
(F) TLQP-21-induced increase in [Ca2+]i, measured by Fluo-4 fluorescence, is blocked by SKF-96365 (F(1,126) = 6.8, p < 0.0001; N = 8–50 cells from 2 different experiments; ISO = 50 nM, TLQP-21 = 10 μM, SKF-96365 = 20 μM, UTP =10 μM) (Figure S4 presents the dose response curves).
Tukey’s post hoc tests; *p < 0.05, **p < 0.01, ***p < 0.001. Data are expressed as average and SEM.
See also Figures S2 and S4 and Table S2.

