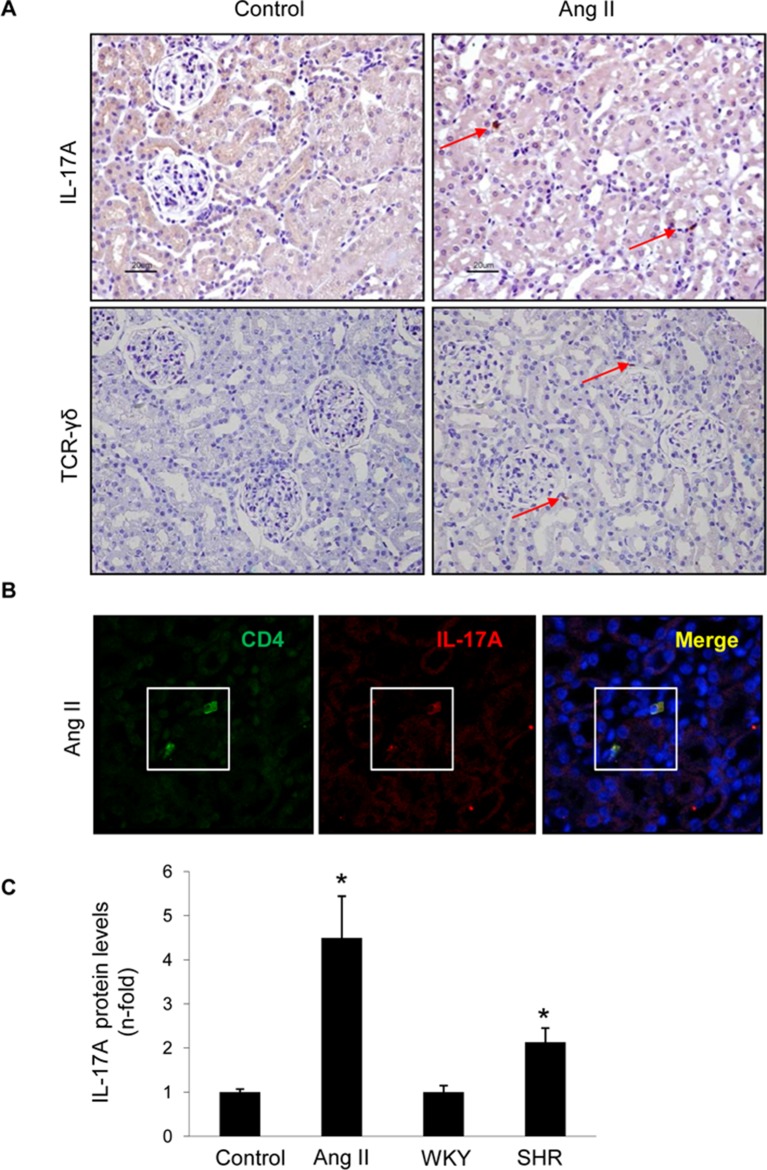
Figure 12.
IL-17A-expressing cells in the kidney of rats with experimental hypertension. (A) The presence of IL-17A and γδ T lymphocytes was detected by immunohistochemistry. Figure shows a representative image. (B) Double immunofluorescence for IL-17A, labeled with an Alexa 633 (red) secondary antibody, and CD4 (for CD4+/Th17 cells) labeled with an Alexa 488 (green) secondary antibody. Nuclei were stained with 4,6-diamidino-2-phenylindole (DAPI; blue). (C) IL-17A protein levels were evaluated in total protein renal extracts by ELISA. The figure shows a confocal microscopy analysis of a representative rat of four studied with similar results. *p < 0.05 vs control.

