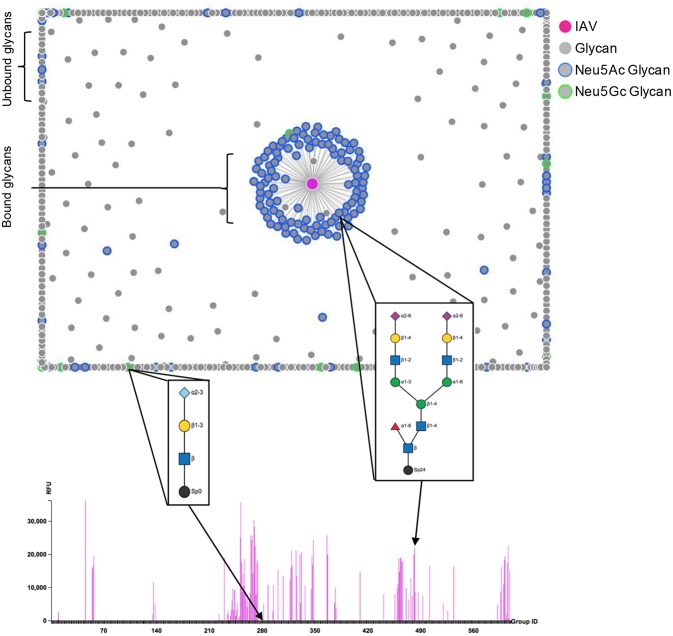
Figure 1.
Influenza A virus binding to CFG array. The strength of IAV binding to each glycan on the CFG array is visualized by the force plot, where bound glycans are linked to the IAV spot (magenta) in the middle and unbound glycans are pushed to the periphery. Neu5Ac and Neu5Gc sialylated glycans are highlighted in blue and green, respectively. The structures corresponding to one example each of Neu5Ac and Neu5Gc terminating glycans are displayed and the binding to each structure is highlighted on the bar chart comparing RFU. Glycan cartoon key: light blue diamond- Neu5Gc, purple diamond- Neu5Ac, yellow circle- Gal, blue square- GlcNAc, green circle- Man, red triangle- Fuc, black circle- linker. Figure produced using the GLycan Array Dashboard (GLAD) program, developed by the Cummings group (Mehta and Cummings, 2019), website- https://glycotoolkit.com/Tools/GLAD/.

