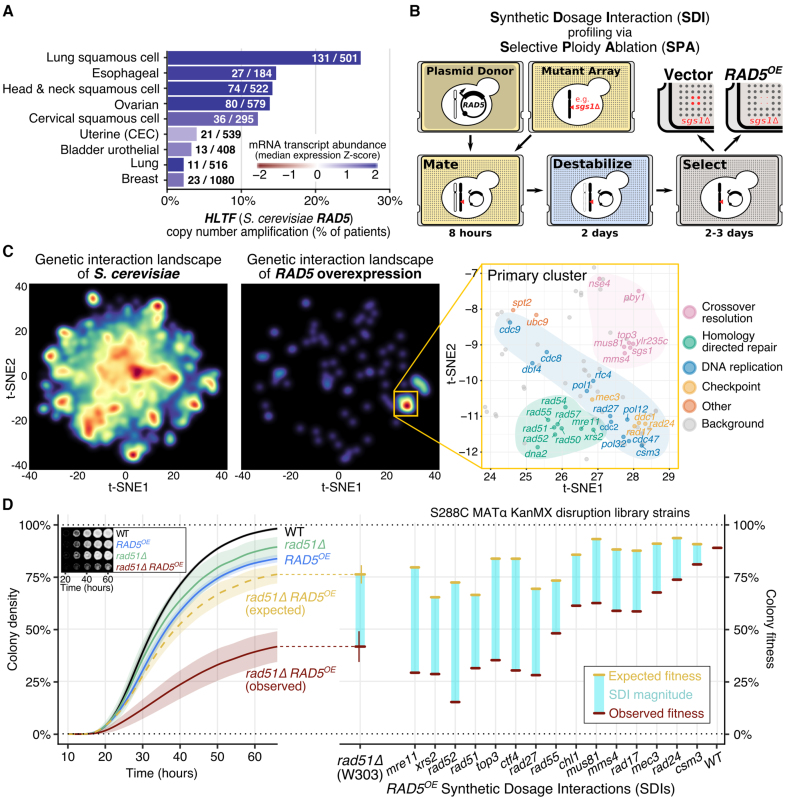
Figure 1.
RAD5 overexpression (RAD5OE) causes a requirement for DNA replication and HDR genes. (A) The RAD5 human ortholog, HLTF, is overexpressed in squamous cell carcinomas. The percent of TCGA tumor samples with amplified HLTF copy number are shown (see ‘Materials and Methods’ section). Bar color corresponds to the median of mRNA expression Z-scores within each cohort. Annotated on each bar are the number of samples with HLTF amplified and the total number of samples for each cohort. (B) Schematic for SDI profiling via Selective Ploidy Ablation (SPA) (38). An engineered donor strain harboring a galactose-inducible RAD5 overexpression vector (RAD5OE) is mated to an array of mutant strains. Donor chromosomes are then destabilized and counter selected. SDIs are scored by comparing colony growth of RAD5OE to an empty vector control (see ‘Materials and Methods’ section). (C) Genetic interaction landscape enrichment for RAD5OE highlights a requirement for DNA replication and HDR genes. On the left, genes represented in the MATa non-essential gene disruption and temperature-sensitive strain collections were clustered with t-SNE in two dimensions using genetic interaction profile correlation data from The Cell Map (see ‘Materials and Methods’ section) (40,41). Dark red spots represent high-density clusters of multiple genes with similar genetic interaction profiles. The locations of RAD5OE SDIs in the landscape are shown in the middle. Two significantly enriched clusters were identified using a permutation test (P < 0.001). On the right, the region of the landscape representing the primary enriched cluster is shown. RAD5OE SDIs are labeled and colored by function. Genes in this region of the landscape that were not identified as having a RAD5OE genetic interaction are labeled background and shown as gray dots. (D) Using a quantitative spot assay, we observe HDR mutants to be the most sensitive to RAD5OE. On the left, growth curves used to quantify the rad51Δ RAD5OE SDI are shown with representative images of colony growth over time shown as an inset. Shaded regions represent the 95% confidence interval (CI) of at least four independent experiments. Expected growth of rad51Δ RAD5OE was modeled by multiplying the independent contributions of rad51Δ and RAD5OE to colony fitness (see ‘Materials and Methods’ section). On the right, differences in observed from expected colony fitness at 65 h of growth are summarized using strains from the MATα gene disruption collection for genes selected from the clusters identified by landscape enrichment analysis.

